
May 27, 2026 a 11:44 am
DVN: Fibonacci Analysis - Devon Energy Corporation
Devon Energy Corporation, a prominent player in the energy sector, has recently demonstrated a notable trend marked by significant price fluctuations. With a focus on oil and natural gas production, its stock movements largely reflect market volatility. Being an independent energy company, its performance is closely tied to global energy prices. Understanding Fibonacci retracement levels could offer insights into potential support and resistance areas. This analysis delves into the recent stock trends of Devon Energy, providing a detailed technical assessment.
Fibonacci Analysis
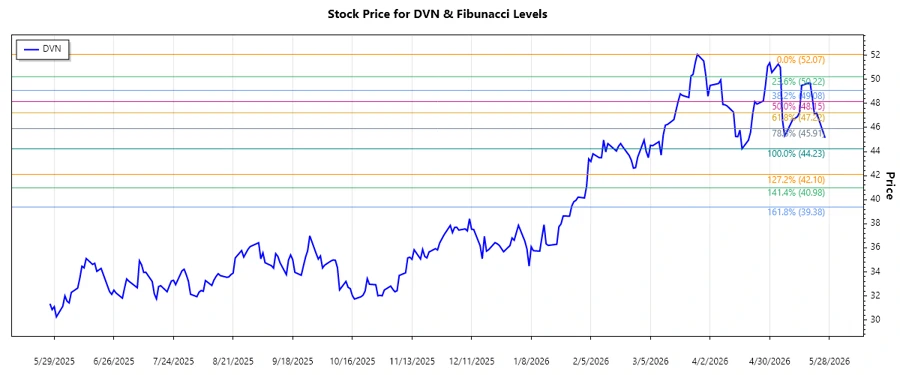
The recent data indicates an observable downtrend for Devon Energy Corporation's stock over the analyzed period.
| Aspect | Details |
|---|---|
| Start Date | 2026-03-27 |
| End Date | 2026-05-26 |
| High Point (Price and Date) | $52.07 on 2026-03-27 |
| Low Point (Price and Date) | $44.23 on 2026-04-17 |
Fibonacci Retracement Levels
| Level | Price |
|---|---|
| 0.236 | $50.32 |
| 0.382 | $49.12 |
| 0.5 | $48.15 |
| 0.618 | $47.18 |
| 0.786 | $45.87 |
The current price is at $45.14, which positions it within the 0.786 Fibonacci retracement level. This suggests potential support at this level.
Conclusion
In the recent months, Devon Energy Corporation has exhibited a descending trend, with its stock reaching the 0.786 retracement level, potentially indicating a support zone. Market volatility continues to be a significant factor, influencing stock performance amidst dynamic energy prices. Analysts might regard the current levels as significant for potential buy or hold positions given the observed support. The combination of technical analysis and energy sector trends could offer valuable insight for making informed investment decisions. However, attention to external factors such as regional or global energy policies remains crucial. Incorporating these insights may offer investors a more comprehensive view of the stock’s potential trajectory.
Smart Data Insight
Master the Perfect Entry & Exit for this Stock
Don't leave your profits to chance. Historically, this stock follows specific seasonal patterns that institutional traders use to maximize returns.
- ✅ Identify the "Golden Buying Window"
- ✅ Avoid high-risk correction cycles
- ✅ Backtested data from the last 20+ years