October 30, 2025 a 03:16 pm
DVN: Fibonacci Analysis - Devon Energy Corporation
The Devon Energy Corporation has shown a fluctuating trend over the recent months. With its substantial involvement in the energy sector, the company's stock has mirrored broader economic movements. Investors interested in energy stocks should take note of Devon's performance for insight into potential market directions.
Fibonacci Analysis
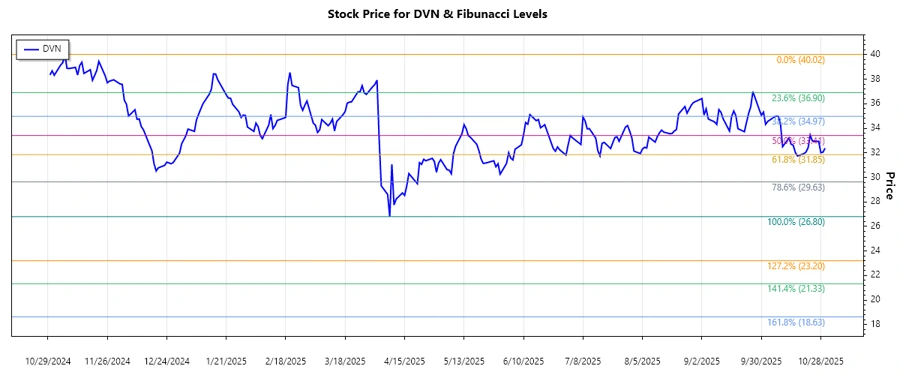
After analyzing the historical data of Devon Energy Corporation (DVN), a dominant downtrend was identified. The trend begun at a high of 40.02 on November 6, 2024, reaching a low of 26.8 on April 8, 2025.
| Trend Analysis | Details |
|---|---|
| Start Date | November 6, 2024 |
| End Date | April 8, 2025 |
| High Point | $40.02 (November 6, 2024) |
| Low Point | $26.8 (April 8, 2025) |
| Current Price | $32.375 (October 30, 2025) |
| Fibonacci Level | Price Level |
|---|---|
| 0.236 | $33.28 |
| 0.382 | $34.61 |
| 0.5 | $35.41 |
| 0.618 | $36.20 |
| 0.786 | $37.29 |
The current price is hovering near the 0.236 Fibonacci retracement level, indicating a possible support zone or resistance, depending on market sentiment.
The data suggests a potential temporary support level for the stock, considering the current price's proximity to a retracement level. Analysts might expect a price correction if this level is maintained.
Conclusion
Devon Energy Corporation's stock has experienced a considerable downtrend over the months, reflecting cyclical volatility in the energy sector. The proximity to the 0.236 retracement level provides a key area to watch. If market conditions are favorable, it could act as a springboard for a recovery, but persistent downturns in broader market sentiment may push prices lower. Analysts and investors should look at external factors impacting energy demand and Devon's strategic maneuvers to gauge future performance. For now, strategic monitoring of market developments and macroeconomic influences is paramount to making informed investment decisions.
Smart Data Insight
Master the Perfect Entry & Exit for this Stock
Don't leave your profits to chance. Historically, this stock follows specific seasonal patterns that institutional traders use to maximize returns.
- ✅ Identify the "Golden Buying Window"
- ✅ Avoid high-risk correction cycles
- ✅ Backtested data from the last 20+ years