September 23, 2025 a 11:45 am
DVN: Fibonacci Analysis - Devon Energy Corporation
Devon Energy Corporation has shown notable movement within the recent months. As an independent energy company, its performance is influenced by the broader energy market dynamics. The stock has recently exhibited an interesting trend that could signify potential trading opportunities for investors. This analysis delves into these historical price movements to provide a clearer picture of future possibilities.
Fibonacci Analysis
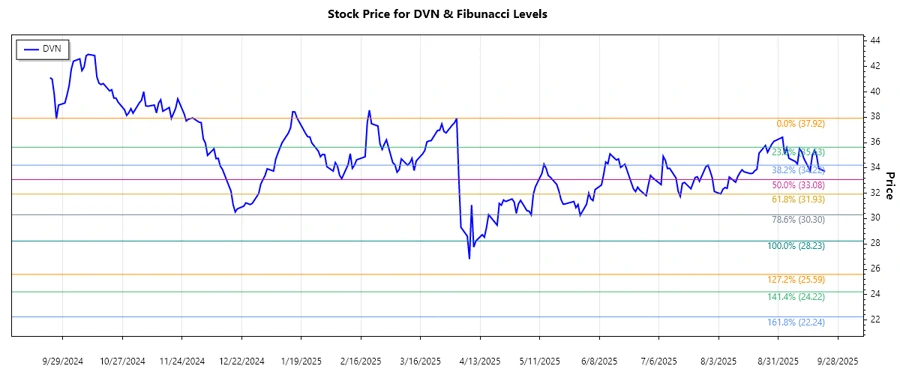
Devon Energy Corporation has recently been in a downward trend, starting from a high in early April 2025. The highest price achieved was $37.92, and the lowest observed was $28.23. By calculating the Fibonacci Retracement levels, we can offer insights into potential future support and resistance levels.
| Start Date | End Date | High Price | Low Price |
|---|---|---|---|
| 2025-04-01 | 2025-09-22 | $37.92 (2025-04-02) | $28.23 (2025-08-11) |
| Fibonacci Level | Price Level |
|---|---|
| 0.236 | $30.70 |
| 0.382 | $31.98 |
| 0.5 | $33.08 |
| 0.618 | $34.18 |
| 0.786 | $35.63 |
The current price of $33.72 is in the 0.5 retracement zone, indicating potential consolidation. This zone can act as a significant support point, suggesting a possible pause or reversal in the trend.
Conclusion
Devon Energy Corporation's recent market movements present a mixed outlook. While currently in a retracement zone, the potential for recovery depends heavily on market conditions and company performance. Investors should consider the broader energy market trends before making decisions. Persistent trading in this area may signal consolidation, offering both risks and opportunities. Analysts view such retracement levels as possible pivot points, where price action could either rebound or continue its descent.
Smart Data Insight
Master the Perfect Entry & Exit for this Stock
Don't leave your profits to chance. Historically, this stock follows specific seasonal patterns that institutional traders use to maximize returns.
- ✅ Identify the "Golden Buying Window"
- ✅ Avoid high-risk correction cycles
- ✅ Backtested data from the last 20+ years