January 16, 2026 a 03:31 pm


DVN: Dividend Analysis - Devon Energy Corporation
Devon Energy Corporation showcases a balanced approach towards dividend payouts with a solid history of 33 years. Despite recent challenges indicated by a slight decline in the 3-year dividend growth rate, the company's cautious payout strategy suggests a focus on sustainability. The recent dividend suspension might raise eyebrows, yet the overall financial posture reveals a calculated risk management approach.
📊 Overview
Devon Energy, a prominent player in the energy sector, presents a dividend yield of 2.65%, indicating moderate shareholder returns. The current dividend per share stands at 1.50 USD, with a rich dividend history of 33 years. Notably, the last dividend cut occurred in 2025, highlighting recent corporate adjustments.
| Metric | Detail |
|---|---|
| Sector | Energy |
| Dividend Yield | 2.65 % |
| Current Dividend per Share | 1.50 USD |
| Dividend History | 33 years |
| Last Cut or Suspension | 2025 |
🗣️ Dividend History
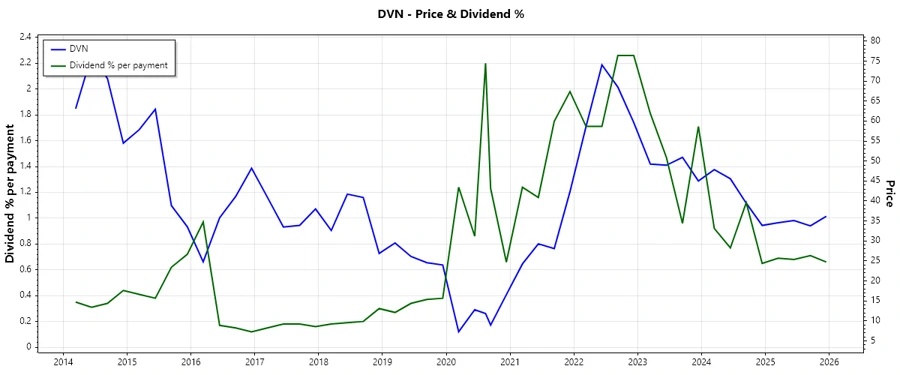
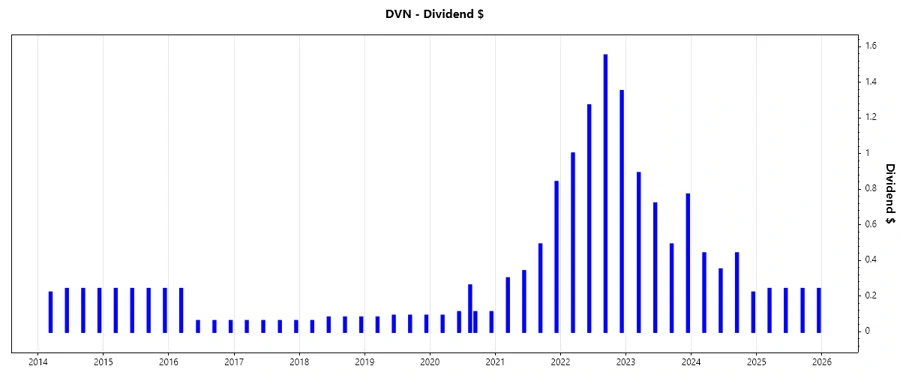
The stability in Devon Energy’s dividend payouts over decades underscores its commitment to returning value to shareholders. However, the latest dividend cut in 2025 serves as a reminder of the volatile macroeconomic climate and its impact on the energy sector.
| Year | Dividend Per Share (USD) |
|---|---|
| 2025 | 0.96 |
| 2024 | 1.45 |
| 2023 | 2.87 |
| 2022 | 5.17 |
| 2021 | 1.97 |
📈 Dividend Growth
Analysis of dividend growth allows investors to gauge the company's commitment to enhancing shareholder value. Despite a shaky 3-year growth figure of -0.43%, the 5-year average growth rate shows a slight positive trend, shedding light on the energy-based challenges faced recently.
| Time | Growth |
|---|---|
| 3 years | -0.43 % |
| 5 years | 0.07 % |
The average dividend growth is 0.07% over 5 years. This shows moderate but steady dividend growth.
⚠️ Payout Ratio
The payout ratios provide insight into Devon Energy’s dividend sustainability. With an EPS payout ratio of 35.12% and a free cash flow payout ratio of 31.50%, the company shows a cautious dividend payout policy, aligning with prudent cash management practices amid fluctuating energy markets.
| Key Figure | Ratio |
|---|---|
| EPS-based | 35.12 % |
| Free cash flow-based | 31.50 % |
These ratios indicate a conservative approach to dividend payouts, ensuring financial stability even in challenging times.
✅ Cashflow & Capital Efficiency
Assessing the cash flow yield and capital efficiency reveals Devon Energy's financial maneuverability. A robust earnings yield coupled with steady CAPEX management reflects positively on the company's operational cash flow sufficiency and investment returns.
| Metric | 2024 | 2023 | 2022 |
|---|---|---|---|
| Free Cash Flow Yield | -0.04 | 0.09 | 0.08 |
| Earnings Yield | 0.14 | 0.13 | 0.15 |
| CAPEX to Operating Cash Flow | 1.13 | 0.60 | 0.60 |
| Stock-based Compensation to Revenue | 0.01 | 0.01 | 0.00 |
| Free Cash Flow / Operating Cash Flow Ratio | -0.13 | 0.40 | 0.40 |
These metrics suggest sound cash flow stability and capital efficiency, crucial for maintaining competitive advantage and growth potential.
📉 Balance Sheet & Leverage Analysis
The leverage ratios provide a comprehensive perspective on Devon Energy’s capital structure and financial health. Continuous management of debt and assets underlines the company’s resilience in adverse market conditions.
| Metric | 2024 | 2023 | 2022 |
|---|---|---|---|
| Debt-to-Equity | 0.63 | 0.53 | 0.60 |
| Debt-to-Assets | 0.30 | 0.26 | 0.28 |
| Debt-to-Capital | 0.39 | 0.35 | 0.37 |
| Net Debt to EBITDA | 1.12 | 0.74 | 0.51 |
| Current Ratio | 1.04 | 1.07 | 1.25 |
| Quick Ratio | 0.95 | 0.99 | 1.19 |
| Financial Leverage | 2.10 | 2.03 | 2.12 |
The ratios reflect solid financial leverage and liquidity management, vital for sustainable company growth and investment potential.
💼 Fundamental Strength & Profitability
Devon Energy's profitability metrics like return on equity and asset efficiency offer insight into company performance. Efficient margins and returns illustrate an ability to extract value from operations and investments.
| Metric | 2024 | 2023 | 2022 |
|---|---|---|---|
| Return on Equity | 0.20 | 0.31 | 0.54 |
| Return on Assets | 0.09 | 0.15 | 0.25 |
| Margins: Net | 0.19 | 0.25 | 0.30 |
| Margins: EBIT | 0.27 | 0.33 | 0.41 |
| Margins: EBITDA | 0.48 | 0.50 | 0.52 |
| Margins: Gross | 0.27 | 0.34 | 0.45 |
| R&D to Revenue | 0.00 | 0.00 | 0.00 |
With sustained improvements in profitability and efficient resource utilization, Devon Energy demonstrates competitive strength in its sector.
⏳ Price Development
🔍 Dividend Scoring System
| Criteria | Score | |
|---|---|---|
| Dividend Yield | 3 | |
| Dividend Stability | 4 | |
| Dividend Growth | 2 | |
| Payout Ratio | 4 | |
| Financial Stability | 4 | |
| Dividend Continuity | 5 | |
| Cash Flow Coverage | 3 | |
| Balance Sheet Quality | 4 |
Total Score: 29/40
🗒️ Rating
In summary, Devon Energy Corporation maintains a resilient financial stance with moderate dividend payouts. Its robust historical payouts and improvements in fundamental strength signify a potentially rewarding investment for shareholders. However, potential investors should remain cautious of sector fluctuations impacting dividend consistency.