December 30, 2025 a 07:46 am

DVN: Dividend Analysis - Devon Energy Corporation
Devon Energy Corporation has maintained a robust dividend history with a remarkable consistency of 33 years, indicating its dedication to returning capital to shareholders. With a current dividend yield of approximately 2.65%, Devon demonstrates an ability to reward its investors, despite some fluctuations in growth. The company's financial metrics suggest a stable payout ratio and solid cash flow generation, which are crucial for sustainable dividend distributions.
📊 Overview
Devon Energy Corporation operates within the energy sector, offering lucrative dividend opportunities. Below is a summary of its pivotal dividend metrics:
| Metric | Detail |
|---|---|
| Sector | Energy |
| Dividend yield | 2.65 % |
| Current dividend per share | 1.50 USD |
| Dividend history | 33 years |
| Last cut or suspension | None |
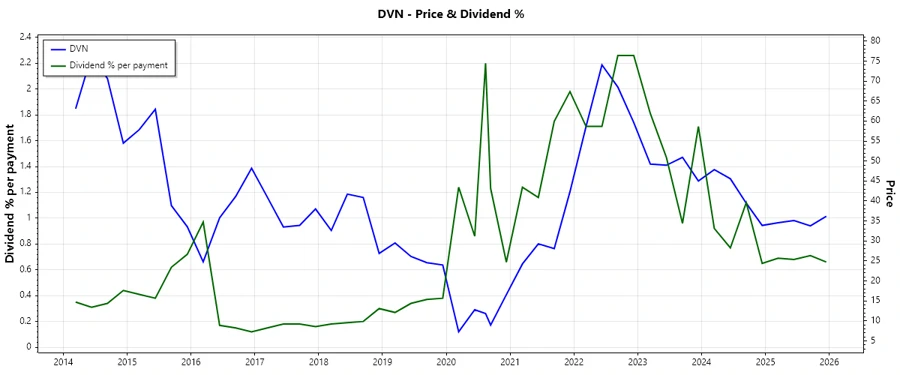
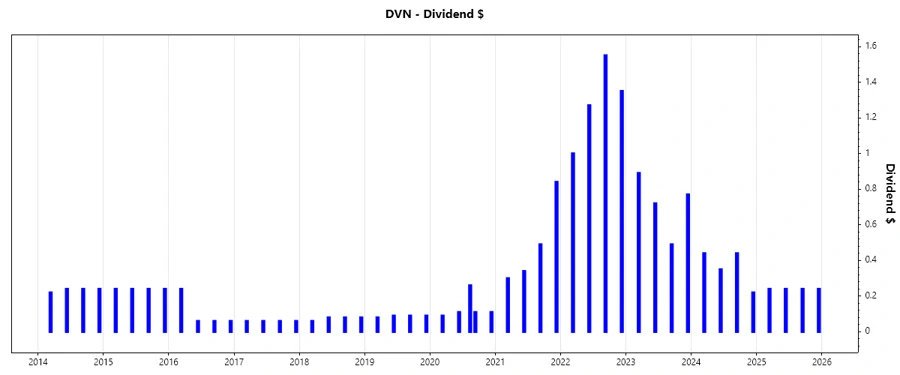
📉 Dividend History
Understanding the dividend history provides insights into the company's dedication to shareholder returns. Devon Energy's commitment is evident in its uninterrupted 33-year dividend payments, highlighted by the following recent distributions.
| Year | Dividend per share (USD) |
|---|---|
| 2025 | 0.96 |
| 2024 | 1.45 |
| 2023 | 2.87 |
| 2022 | 5.17 |
| 2021 | 1.97 |
📈 Dividend Growth
The growth of dividends is a testament to a company's financial health and future potential. Although recent growth over the past 3 years has been negative at -0.10%, a 5-year perspective shows a healthier growth rate of 32.88%, suggesting that short-term volatility has not undermined long-term stability.
| Time | Growth |
|---|---|
| 3 years | -0.10 % |
| 5 years | 32.88 % |
The average dividend growth is 32.88% over 5 years. This shows moderate but steady dividend growth.
✅ Payout Ratio
The payout ratio is pivotal in assessing dividend sustainability. Devon's EPS-based payout ratio is 35.12%, paired with an FCF-based payout ratio of 31.73%. These figures suggest a conservative and sustainable approach to dividends, allowing room for reinvestment and financial flexibility.
| Key figure | Ratio |
|---|---|
| EPS-based | 35.12 % |
| Free cash flow-based | 31.73 % |
These payout ratios indicate a well-managed balance between rewarding shareholders and retaining profits for growth and stability, presenting an attractive risk-adjusted investment opportunity.
⚠️ Cashflow & Capital Efficiency
Evaluating cash flow and capital efficiency is instrumental in determining a company's fiscal robustness. Key metrics, such as free cash flow yield and earnings yield, reveal Devon's ability to generate cash relative to its market value, highlighting efficiency in capital allocation.
| Metric | 2024 | 2023 | 2022 |
|---|---|---|---|
| Free Cash Flow Yield | -4.18% | 8.97% | 8.50% |
| Earnings Yield | 14.18% | 12.94% | 15.02% |
| CAPEX to Operating Cash Flow | 112.92% | 60.31% | 60.08% |
| Stock-based Compensation to Revenue | 0.64% | 0.61% | 0.44% |
| Free Cash Flow / Operating Cash Flow Ratio | -12.92% | 39.68% | 39.92% |
Devon's capital allocation strategy manifests in its robust free cash flow yield and prudent reinvestment ratios, reflecting commendable cash generation and efficient capital use.
⚖️ Balance Sheet & Leverage Analysis
A meticulous examination of leverage metrics is pivotal for understanding Devon's financial posture. The following ratios indicate the level of debt relative to assets and equity, providing insights into the company's leverage and liquidity profile.
| Metric | 2024 | 2023 | 2022 |
|---|---|---|---|
| Debt-to-Equity | 63.49% | 53.48% | 59.97% |
| Debt-to-Assets | 30.18% | 26.34% | 28.23% |
| Debt-to-Capital | 38.83% | 34.84% | 37.49% |
| Net Debt to EBITDA | 1.12 | 0.74 | 0.51 |
| Current Ratio | 1.04 | 1.07 | 1.25 |
| Quick Ratio | 0.95 | 0.99 | 1.19 |
| Financial Leverage | 2.10 | 2.03 | 2.12 |
With manageable debt levels and strong liquidity ratios, Devon Energy exhibits a sound balance sheet, enhancing its resilience to market fluctuations and economic downturns.
💡 Fundamental Strength & Profitability
Profitability and fundamental strength are at the core of long-term corporate success. Key profitability ratios highlight Devon's ability to effectively translate sales into profits and consequentially deliver robust shareholder value.
| Metric | 2024 | 2023 | 2022 |
|---|---|---|---|
| Return on Equity | 19.94% | 31.07% | 53.86% |
| Return on Assets | 9.48% | 15.30% | 25.36% |
| Net Margin | 18.57% | 24.75% | 30.34% |
| EBIT Margin | 26.58% | 32.93% | 40.96% |
| EBITDA Margin | 47.74% | 49.99% | 52.36% |
| Gross Margin | 27.43% | 34.35% | 45.26% |
| R&D to Revenue | 0.00% | 0.00% | 0.00% |
Devon's profitability metrics underscore its established market position and capacity for sustaining high returns, with substantial returns on equity and assets in recent years supporting its competitive advantage.
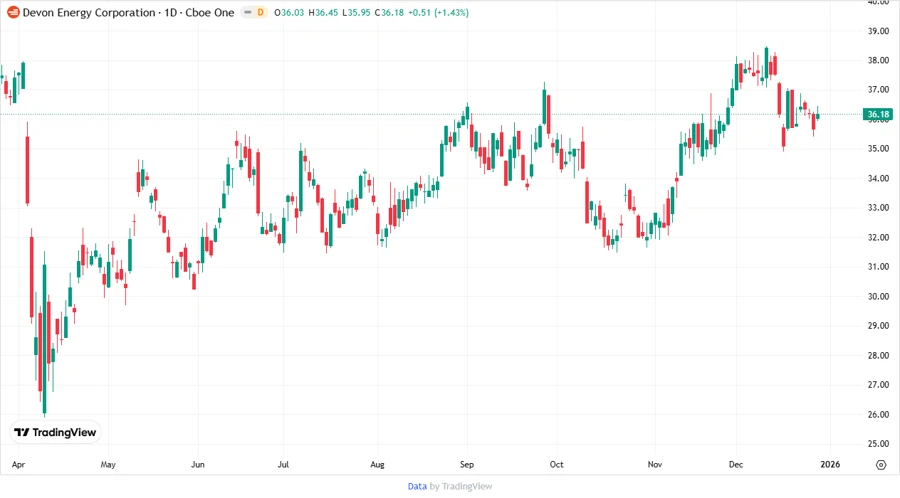
📆 Price Development
🔍 Dividend Scoring System
| Category | Score | Score Bar |
|---|---|---|
| Dividend yield | 4 | |
| Dividend Stability | 5 | |
| Dividend growth | 3 | |
| Payout ratio | 5 | |
| Financial stability | 4 | |
| Dividend continuity | 5 | |
| Cashflow Coverage | 4 | |
| Balance Sheet Quality | 4 |
Score: 34/40
🌟 Rating
Devon Energy Corporation offers a compelling dividend profile characterized by consistent distribution, financial prudence, and strategic growth. With a near-perfect dividend continuity and a disciplined payout strategy, Devon Energy is an attractive proposition for dividend-focused investors. Despite some headwinds in recent dividend growth, the company's dedication to shareholder returns and its strong balance sheet position it well for the future.