November 03, 2025 a 12:47 pm

DVN: Dividend Analysis - Devon Energy Corporation
Devon Energy Corporation, operating in the energy sector, has maintained a consistent dividend payout over the past 33 years, showing a commitment to returning value to shareholders. Despite the energy sector's inherent volatility, Devon Energy has effectively managed its dividend policy without any recent cuts or suspensions. However, with a 5-year average dividend growth of just over 32%, the company displays moderate growth potential.
📊 Overview
| Key Metric | Details |
|---|---|
| Sector | Energy |
| Dividend yield | 2.78 % |
| Current dividend per share | 1.50 USD |
| Dividend history | 33 years |
| Last cut or suspension | None |
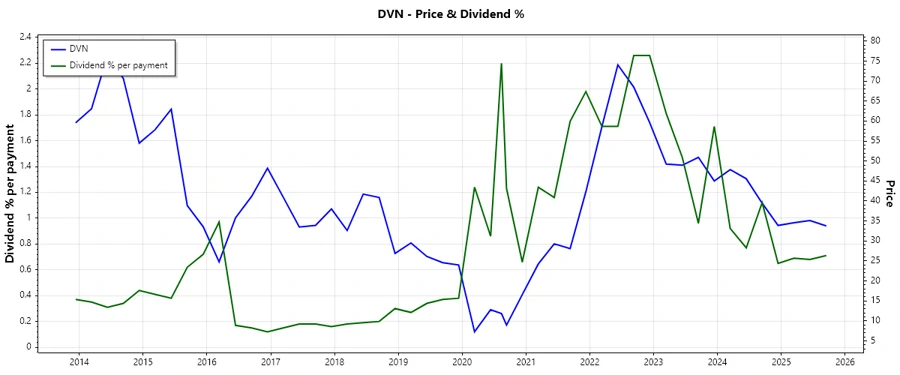
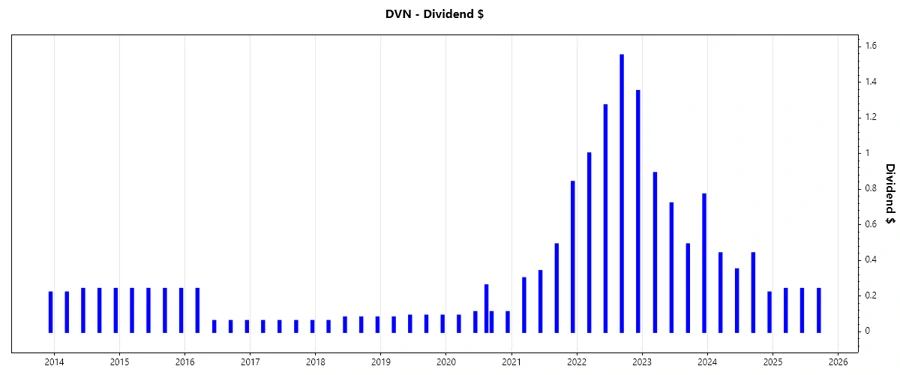
📉 Dividend History
The historical consistency in Devon Energy's dividend payouts underscores its stability and reliability as an income-generating investment. This track record is crucial for investors seeking predictable returns. Understanding past trends can inform expectations of future performance.
| Year | Dividend per share (USD) |
|---|---|
| 2025 | 0.72 |
| 2024 | 1.45 |
| 2023 | 2.87 |
| 2022 | 5.17 |
| 2021 | 1.97 |
📈 Dividend Growth
Dividend growth is a crucial metric for measuring a company's ability to increase payouts over time, reflecting its financial health and operational efficiency. The 5-year dividend growth of 32.88% signals Devon Energy's capacity to sustain and potentially enhance its shareholder return strategy.
| Time | Growth |
|---|---|
| 3 years | -9.71 % |
| 5 years | 32.88 % |
The average dividend growth is 32.88 % over 5 years. This shows moderate but steady dividend growth.
🗣️ Payout Ratio
The payout ratio is a measure of sustainability, indicating the percentage of earnings distributed as dividends. A lower ratio is generally preferable as it suggests more room for growth.
| Key figure | Ratio |
|---|---|
| EPS-based | 33.58 % |
| Free cash flow-based | -80.00 % |
The EPS-based payout ratio of 33.58 % is healthy, indicating a sustainable dividend. However, the negative FCF-based ratio highlights potential cash flow issues that could impact future dividends.
⚖️ Cashflow & Capital Efficiency
Analyzing cash flow and efficiency ratios provides insight into the company's ability to generate cash and use capital effectively, critical for sustainable growth and dividend payments.
| Metric | 2024 | 2023 | 2022 |
|---|---|---|---|
| Free Cash Flow Yield | -4.18 % | 8.97 % | 8.50 % |
| Earnings Yield | 14.18 % | 12.94 % | 15.02 % |
| CAPEX to Operating Cash Flow | 122.64 % | 60.31 % | 60.08 % |
| Stock-based Compensation to Revenue | 0.64 % | 0.61 % | 0.44 % |
| Free Cash Flow / Operating Cash Flow Ratio | -12.92 % | 39.68 % | 39.92 % |
| Return on Invested Capital | 10.80 % | 17.80 % | 31.92 % |
The data suggests fluctuating cash flow stability, with recent years showing better yields and effective use of capital, although negative cash flow yields in the latest year may require closer attention.
💼 Balance Sheet & Leverage Analysis
Understanding leverage ratios and balance sheet strength is crucial for assessing financial stability, potential risks, and the ability to meet obligations, especially in volatile markets.
| Metric | 2024 | 2023 | 2022 |
|---|---|---|---|
| Debt-to-Equity | 63.49 % | 53.48 % | 59.97 % |
| Debt-to-Assets | 30.18 % | 26.34 % | 28.23 % |
| Debt-to-Capital | 38.83 % | 34.84 % | 37.49 % |
| Net Debt to EBITDA | 1.125 | 0.737 | 0.505 |
| Current Ratio | 1.22 | - | 1.25 |
| Quick Ratio | 0.95 | 0.99 | 1.19 |
| Financial Leverage | 2.10 | 2.03 | 2.12 |
The leverage analysis reflects a manageable debt level with consistent ratios, supporting liquidity, and greater financial flexibility.
🔥 Fundamental Strength & Profitability
A robust profitability profile suggests a more efficient operation with higher profit margins, showcasing the company's competitive position in the industry.
| Metric | 2024 | 2023 | 2022 |
|---|---|---|---|
| Return on Equity | 19.94 % | 31.07 % | 53.86 % |
| Return on Assets | 9.48 % | 15.30 % | 25.36 % |
| Margins: Net | 18.57 % | 24.74 % | 30.34 % |
| Margins: EBIT | 26.58 % | 32.93 % | 40.96 % |
| Margins: EBITDA | 47.74 % | 49.99 % | 52.36 % |
| Research & Development to Revenue | - | - | - |
Strong profitability metrics enhance the company's appeal to investors. Devon Energy's impressive ROE and net margins portray a competitive edge within the energy sector.
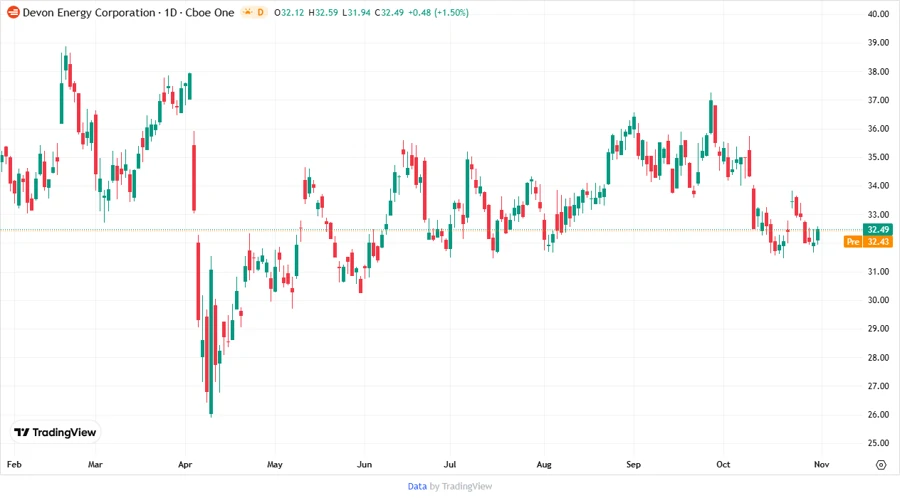
💹 Price Development
✅ Dividend Scoring System
| Criteria | Score (out of 5) | Score Bar |
|---|---|---|
| Dividend yield | 3 | |
| Dividend Stability | 5 | |
| Dividend growth | 3 | |
| Payout ratio | 4 | |
| Financial stability | 4 | |
| Dividend continuity | 5 | |
| Cashflow Coverage | 2 | |
| Balance Sheet Quality | 4 |
Total Score: 30/40
🗣️ Rating
Devon Energy Corporation maintains a commendable dividend profile, offering a stable yield with growth potential. With robust financial metrics and a dependable dividend history, it remains an attractive choice for income-focused investors, though some attention is warranted due to cash flow volatility. Overall, it provides a reliable and moderately growing income stream.
Smart Data Insight
Master the Perfect Entry & Exit for this Stock
Don't leave your profits to chance. Historically, this stock follows specific seasonal patterns that institutional traders use to maximize returns.
- ✅ Identify the "Golden Buying Window"
- ✅ Avoid high-risk correction cycles
- ✅ Backtested data from the last 20+ years