August 06, 2025 a 11:31 am


DVN: Dividend Analysis - Devon Energy Corporation
Devon Energy Corporation, with a significant presence in the energy sector, has a strong dividend history spanning over 30 years. Despite a slightly negative growth rate over the past 3 years, the long-term dividend growth remains positive. The company's payout ratios suggest a cautious but steady approach to maintaining dividend payments, making it an attractive option for income-focused investors.
📊 Overview
Devon Energy Corporation operates within the energy sector, demonstrating a dividend yield of 3.25% currently. With a diverse dividend history of 33 years, the company shows resilience. The recent dividend per share stands at $1.48, and there haven't been any recent cuts or suspensions.
| Category | Details |
|---|---|
| Sector | Energy |
| Dividend Yield | 3.25% |
| Current Dividend Per Share | $1.48 |
| Dividend History | 33 years |
| Last Cut or Suspension | None |
📈 Dividend History
Understanding past dividends is key to predicting future stability. Devon's history points towards reliability, given its long-term payout record. Here's a snapshot of the most recent dividend distributions:
| Year | Dividend Per Share (USD) |
|---|---|
| 2025 | 0.48 |
| 2024 | 1.45 |
| 2023 | 2.87 |
| 2022 | 5.17 |
| 2021 | 1.97 |
📉 Dividend Growth
The growth trends offer insight into future potential. Over the last five years, Devon Energy has managed moderate growth despite some recent volatility.
| Time | Growth |
|---|---|
| 3 years | -9.71% |
| 5 years | 32.88% |
The average dividend growth is 32.88% over 5 years. This shows moderate but steady dividend growth.
✅ Payout Ratio
The payout ratios are integral to assessing dividend sustainability. Devon Energy's current EPS payout ratio stands at 34.18%, while its FCF payout ratio is uncharacteristically negative at -143.15%. The EPS ratio suggests dividends are well covered by earnings, though the negative FCF ratio warrants careful monitoring to ensure continued sustainability.
| Key Figure Ratio | Value |
|---|---|
| EPS-based | 34.18% |
| Free Cash Flow-based | -143.15% |
💰 Cashflow & Capital Efficiency
Analyzing cash flow efficiency offers a deeper insight into fiscal health and investment potential.
| Measure | 2024 | 2023 | 2022 |
|---|---|---|---|
| Free Cash Flow Yield | -4.12% | 8.97% | 8.50% |
| Earnings Yield | 13.97% | 12.94% | 15.02% |
| CAPEX to Operating Cash Flow | 1.13% | 0.60% | 0.60% |
| Stock-based Compensation to Revenue | 0.62% | 0.61% | 0.46% |
| Free Cash Flow / Operating Cash Flow Ratio | -12.92% | 39.68% | 39.92% |
Devon Energy's recent fiscal presentations highlight a mixed performance, requiring monitoring for stability to capitalize on inherent efficiency opportunities.
📉 Balance Sheet & Leverage Analysis
Devon's balance sheet reflects its leverage and operational stability. Maintaining a healthy debt ratio and leveraging balance determines fiscal fitness.
| Measure | 2024 | 2023 | 2022 |
|---|---|---|---|
| Debt-to-Equity | 0.63 | 0.54 | 0.60 |
| Debt-to-Assets | 0.30 | 0.26 | 0.28 |
| Debt-to-Capital | 0.39 | 0.35 | 0.37 |
| Net Debt to EBITDA | 1.14 | 0.74 | 0.50 |
| Current Ratio | 1.04 | 1.07 | 1.25 |
| Quick Ratio | 0.95 | 0.99 | 1.19 |
| Financial Leverage | 2.10 | 2.03 | 2.12 |
Overall, Devon's financial framework is stable, with prudent leverage. Stability in metrics shows effective balance sheet governance.
🗣️ Fundamental Strength & Profitability
Profitability ratios expose the operational success of the company while fundamental strength highlights efficiency travel.
| Measure | 2024 | 2023 | 2022 |
|---|---|---|---|
| Return on Equity | 19.94% | 31.07% | 53.86% |
| Return on Assets | 9.48% | 15.30% | 25.36% |
| ROIC | 10.63% | 17.17% | 28.90% |
| Net Margin | 18.14% | 24.56% | 31.38% |
| EBIT Margin | 25.80% | 32.68% | 42.49% |
| EBITDA Margin | 46.22% | 49.61% | 54.28% |
| Gross Margin | 59.61% | 64.07% | 73.81% |
| R&D to Revenue | 0% | 0% | 0% |
The reported margins suggest proficiency in converting revenue into profit while maintaining robust utilization of assets and equity.
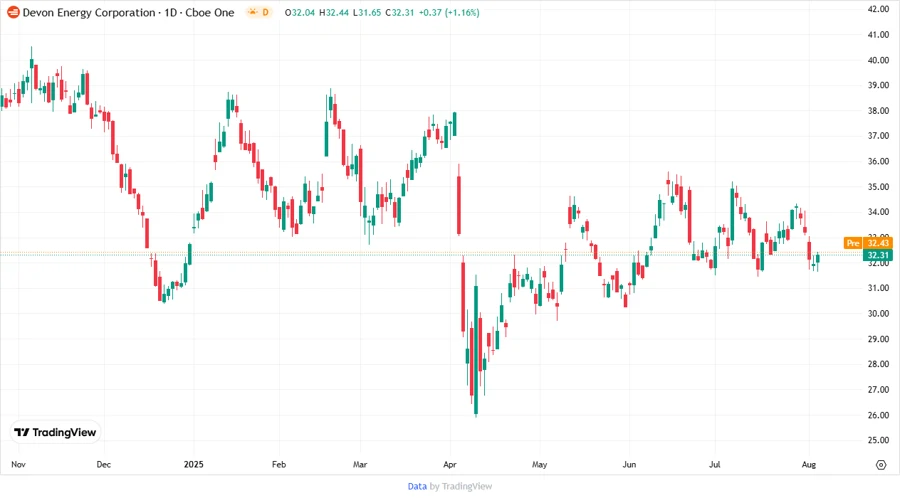
📈 Price Development
⭐ Dividend Scoring System
Devon Energy Corporation is evaluated using a comprehensive dividend scoring system based on key financial health indicators and dividend metrics.
| Criteria | Score | Bar |
|---|---|---|
| Dividend Yield | 4 | |
| Dividend Stability | 4 | |
| Dividend Growth | 3 | |
| Payout Ratio | 3 | |
| Financial Stability | 4 | |
| Dividend Continuity | 5 | |
| Cashflow Coverage | 3 | |
| Balance Sheet Quality | 4 |
Total Score: 30/40
✅ Rating
Devon Energy Corporation presents a versatile yet cautious dividend disbursement strategy, with impressive financial stability and operational efficiencies. Recommended as a robust income-generating asset, suitable for investors prioritizing both dividend yield and growth potential.
Smart Data Insight
Master the Perfect Entry & Exit for this Stock
Don't leave your profits to chance. Historically, this stock follows specific seasonal patterns that institutional traders use to maximize returns.
- ✅ Identify the "Golden Buying Window"
- ✅ Avoid high-risk correction cycles
- ✅ Backtested data from the last 20+ years