November 12, 2025 a 04:45 pm
DVA: Fibonacci Analysis - DaVita Inc.
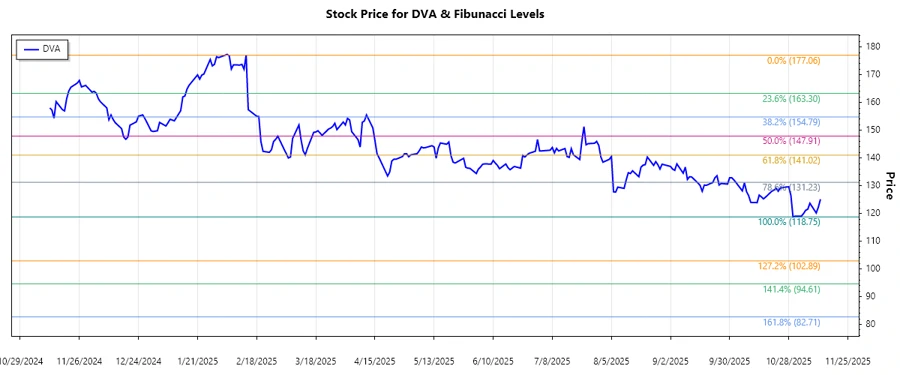
DaVita Inc., a key player in the kidney dialysis service sector, has seen a significant decline in its stock prices over the past months. The analysis indicates a dominant downtrend, suggesting potential caution for investors. Given the current market conditions, DaVita presents both challenges and opportunities in the healthcare industry, depending on future performance and market dynamics.
Fibonacci Analysis
| Details | Data |
|---|---|
| Start Date | 2024-12-11 |
| End Date | 2025-11-12 |
| High Price | $177.06 on 2025-02-13 |
| Low Price | $118.75 on 2025-10-30 |
| Fibonacci Level | Price Level |
|---|---|
| 0.236 | $132.98 |
| 0.382 | $143.37 |
| 0.5 | $147.91 |
| 0.618 | $152.45 |
| 0.786 | $159.00 |
Current Price (2025-11-12): $125.12 is outside of the retracement zone and suggests potential further bearish movement if no support level is found soon. In the context of technical analysis, the current level could play as a significant resistance point before the stock possibly rebounds.
Conclusion
The analysis of DaVita Inc.'s stock suggests significant downward pressure as seen in the historical downtrend. Investors should remain vigilant as the current price remains outside the Fibonacci retracement zone, indicating continued vulnerability. Key considerations for analysts will include monitoring for potential support levels to be established near the 0.236 or even further down. Opportunities may arise should the price find a foothold, but risks remain elevated given the prevailing trend.
Smart Data Insight
Master the Perfect Entry & Exit for this Stock
Don't leave your profits to chance. Historically, this stock follows specific seasonal patterns that institutional traders use to maximize returns.
- ✅ Identify the "Golden Buying Window"
- ✅ Avoid high-risk correction cycles
- ✅ Backtested data from the last 20+ years