October 08, 2025 a 11:45 amHTML
DVA: Fibonacci Analysis - DaVita Inc.
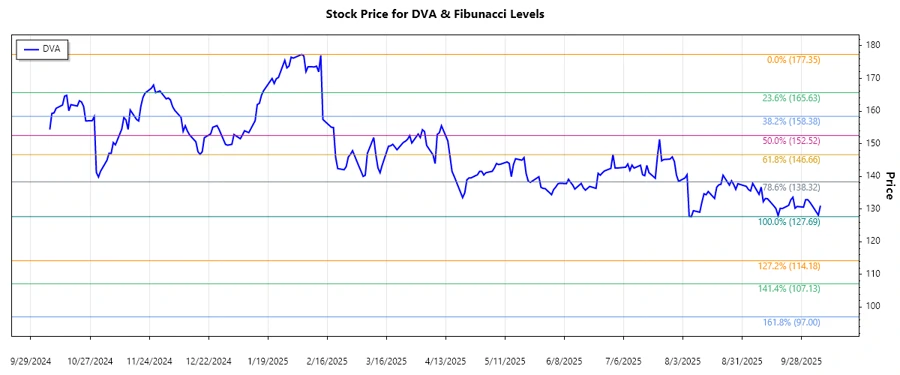
DaVita Inc. has shown a significant downtrend in recent months, highlighted by a consistent depreciation of its stock price. Investors should be cautious as the current market environment presents challenges, yet also potential opportunities for those considering entering at Fibonacci retracement levels. Technical analysis reveals important retracement marks that could serve as support or resistance in the near term.
Fibonacci Analysis
| Parameter | Details | ||||||||||||
|---|---|---|---|---|---|---|---|---|---|---|---|---|---|
| Trend Analysis Period | 2024-10-08 to 2025-10-07 | ||||||||||||
| High Point | $177.35 (2025-02-04) | ||||||||||||
| Low Point | $127.69 (2025-08-07) | ||||||||||||
| Fibonacci Levels |
|
||||||||||||
| Current Price | $131.04 | ||||||||||||
| Retracement Zone | none | ||||||||||||
| Interpretation | The price is below the 0.236 Fibonacci retracement level, indicating potential continuation of the downtrend. Watch for support near this level. |
Conclusion
The analysis of DaVita Inc.'s stock highlights continued downward momentum, with the stock price nearing critical retracement levels. This situation may introduce short-term trading opportunities for investors anticipating corrections. However, the dominance of the current downtrend can't be ignored, posing a significant risk. Analysts should monitor the $139-$140 range for insight on potential reversals or further declines. As always, fundamental analysis should complement technical insights to guide investment decisions.
Smart Data Insight
Master the Perfect Entry & Exit for this Stock
Don't leave your profits to chance. Historically, this stock follows specific seasonal patterns that institutional traders use to maximize returns.
- ✅ Identify the "Golden Buying Window"
- ✅ Avoid high-risk correction cycles
- ✅ Backtested data from the last 20+ years