
July 21, 2026 a 08:15 am
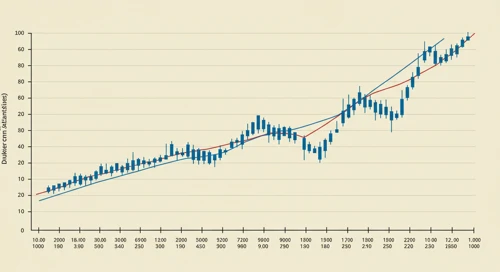


DUK: Trend and Support & Resistance Analysis - Duke Energy Corporation
In analyzing Duke Energy's stock over the past few months, it is evident that the company is operating in an industry with stable demand. Recent stock movements reflect a series of fluctuations with no dominant long-term trend. The short-term moving average suggests a neutral to slightly negative outlook. Support and resistance levels are well-defined, indicating potential territories for stock stabilization and reversal.
Trend Analysis
| Date | Close Price | Trend |
|---|---|---|
| 2026-07-20 | 125.85 | ⚖️ |
| 2026-07-17 | 125.01 | ⚖️ |
| 2026-07-16 | 126.11 | ⚖️ |
| 2026-07-15 | 124.34 | ⚖️ |
| 2026-07-14 | 126.37 | ⚖️ |
| 2026-07-13 | 126.86 | ⚖️ |
| 2026-07-10 | 125.48 | ⚖️ |
The trend suggests a neutral outlook, as the EMA20 is nearly equal to EMA50, indicating a possible consolidation phase.
Support and Resistance
| Type | Zone From | Zone To |
|---|---|---|
| Support | 123.00 ▲ | 124.00. |
| Support | 120.50 ▲ | 122.00. |
| Resistance | 127.00 ▼ | 128.00. |
| Resistance | 129.50 ▼ | 131.00. |
The current price is within a consolidation zone but is closer to a lower support level, suggesting potential for upward movement if support holds.
Conclusion
Duke Energy's stock currently shows mixed signals with recent price action indicating consolidation. The technical analysis suggests a neutral outlook, with defined support and resistance levels. These zones can act as short-term pivot points, offering potential trading opportunities. The near-zero slope EMA indicates there isn’t a strong bias to either side. Long-term investors may see this as a period of stability, while short-term traders might look for breakouts from these levels. A close watch on volume and news for any catalyst might shift the trend significantly.
Smart Data Insight
Master the Perfect Entry & Exit for this Stock
Don't leave your profits to chance. Historically, this stock follows specific seasonal patterns that institutional traders use to maximize returns.
- ✅ Identify the "Golden Buying Window"
- ✅ Avoid high-risk correction cycles
- ✅ Backtested data from the last 20+ years