May 09, 2026 a 11:31 am

DUK: Dividend Analysis - Duke Energy Corporation
Duke Energy Corporation, with a notable history of 44 years of dividend payments without suspension, demonstrates solid dividend credentials. The company's dividend yield is currently at 3.31%, reflecting a steady income return relative to its market value. Its ongoing commitment to dividends is underscored by consistent growth, albeit modest, which appeals to conservative income investors. As a major player in the utilities sector, Duke Energy's strategic dividend policy offers reliability amidst its significant market capitalization.
📊 Overview
Duke Energy Corporation stands as a major entity in the Utilities sector, characterized by a substantial market presence and a dividend yield of 3.31%. The current dividend per share is $4.25, supported by a robust 44-year history of payments without any recent cuts or suspensions.
| Feature | Details |
|---|---|
| Sector | Utilities |
| Dividend yield | 3.31% |
| Current dividend per share | $4.25 USD |
| Dividend history | 44 years |
| Last cut or suspension | None |
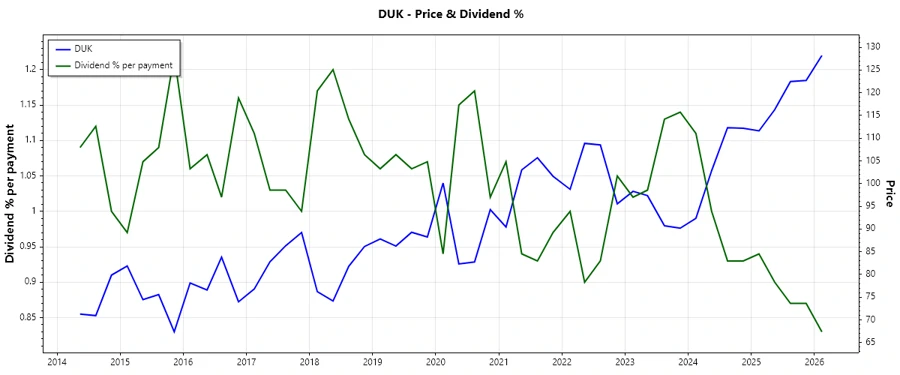
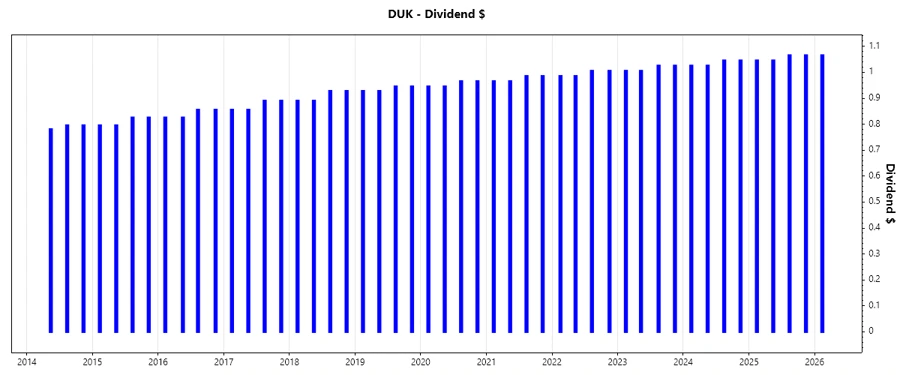
📈 Dividend History
Duke Energy Corporation's commitment to consistent dividend payments exemplifies financial reliability and investor confidence. This consistent payout history acts as a safeguard during financial downturns, providing steady income to shareholders.
| Year | Dividend per Share (USD) |
|---|---|
| 2026 | 1.065 |
| 2025 | 4.220 |
| 2024 | 4.140 |
| 2023 | 4.060 |
| 2022 | 3.980 |
🚀 Dividend Growth
The growth in Duke Energy's dividends over the years provides insight into the company's strategic financial planning and commitment to shareholder returns. The evaluation of dividend growth illuminates potential future income increases for shareholders.
| Time | Growth |
|---|---|
| 3 years | 1.97% |
| 5 years | 2.01% |
The average dividend growth is 2.01% over 5 years. This shows moderate but steady dividend growth, reflecting Duke Energy's consistent commitment to increasing shareholder value.
🗂️ Payout Ratio
The payout ratio metric provides insight into the sustainability of Duke Energy's dividend payments. A balance between paying profits as dividends and retaining them for business operations is crucial for long-term viability.
| Key figure | Ratio |
|---|---|
| EPS-based | 64.30% |
| Free cash flow-based | 50.14% |
An EPS-based payout ratio of 64.30% alongside a free cash flow-based ratio of 50.14% suggests a well-managed strategy keeping payouts within a sustainable range, providing reassurance around dividend reliability.
💵 Cashflow & Capital Efficiency
The analysis of cash flow metrics aids in understanding the efficiency and stability of Duke Energy's operations. These metrics reflect the company's ability to generate and effectively use cash, which directly impacts shareholder returns over time.
| Metric | 2023 | 2024 | 2025 |
|---|---|---|---|
| Free Cash Flow Yield | -3.64% | 0.06% | -1.84% |
| Earnings Yield | 5.74% | 5.42% | 5.45% |
| CAPEX to Operating Cash Flow | 127.60% | 99.61% | 113.54% |
| Stock-based Compensation to Revenue | 0% | 0% | 0% |
| Free Cash Flow / Operating Cash Flow Ratio | -27.60% | 0.39% | -13.54% |
The cash flow stability and capital efficiency showcased by Duke Energy highlight its capability to maintain dividend payments amid fluctuating operational cash generations, therefore reinforcing its equity value.
⚖️ Balance Sheet & Leverage Analysis
Examining balance sheet ratios provides insight into Duke Energy's financial strength and risk profile, key considerations for assessing dividend safety amid varying economic climates.
| Metric | 2023 | 2024 | 2025 |
|---|---|---|---|
| Debt-to-Equity | 1.64 | 1.70 | 1.75 |
| Debt-to-Assets | 0.455 | 0.457 | 0.464 |
| Debt-to-Capital | 0.621 | 0.630 | 0.637 |
| Net Debt to EBITDA | 5.78 | 5.66 | 5.78 |
| Current Ratio | 0.74 | 0.67 | 0.55 |
| Quick Ratio | 0.49 | 0.44 | 0.33 |
| Financial Leverage | 3.60 | 3.72 | 3.78 |
Duke Energy's leverage metrics indicate a well-structured balance sheet, showing an adept handling of debt obligations in line with capital stability. However, moderately high leverage suggests ongoing vigilance is necessary.
💪 Fundamental Strength & Profitability
An assessment of core financial strength and profitability offers a comprehensive view of Duke Energy's ability to maintain and improve its market position, crucial for sustained shareholder returns.
| Metric | 2023 | 2024 | 2025 |
|---|---|---|---|
| Return on Equity | 8.75% | 8.99% | 9.58% |
| Return on Assets | 2.43% | 2.42% | 2.54% |
| Return on Invested Capital | 3.85% | 4.02% | 4.13% |
| Net Margin | 14.78% | 14.86% | 15.41% |
| EBIT Margin | 26.78% | 28.26% | 28.99% |
| EBITDA Margin | 47.71% | 49.40% | 48.61% |
| Gross Margin | 47.34% | 50.06% | 31.56% |
| R&D to Revenue | 0% | 0% | 0% |
These ratios affirm Duke Energy's strong profitability position, indicating effective management of operating expenses and capital, which can continue to bolster dividend payouts.
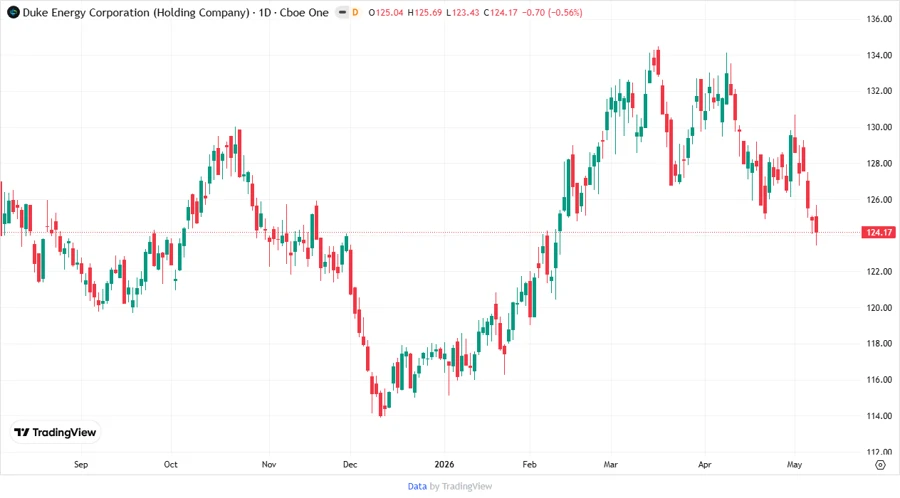
📉 Price Development
🔍 Dividend Scoring System
| Criteria | Score | Bar |
|---|---|---|
| Dividend yield | 4 | |
| Dividend Stability | 5 | |
| Dividend growth | 3 | |
| Payout ratio | 4 | |
| Financial stability | 3 | |
| Dividend continuity | 5 | |
| Cashflow Coverage | 3 | |
| Balance Sheet Quality | 3 |
Total Score: 30/40
✅ Rating
In conclusion, Duke Energy Corporation exhibits strength through its consistent dividend payment history and its overall stable financial health. The company's focus on steady—but not aggressive—dividend growth indicates a balanced strategy that supports long-term income reliability for investors. While high leverage poses some risks, Duke Energy's strategic management of payouts supports a BUY recommendation for dividend-focused investors seeking stable income.
Smart Data Insight
Master the Perfect Entry & Exit for this Stock
Don't leave your profits to chance. Historically, this stock follows specific seasonal patterns that institutional traders use to maximize returns.
- ✅ Identify the "Golden Buying Window"
- ✅ Avoid high-risk correction cycles
- ✅ Backtested data from the last 20+ years