
April 15, 2026 a 11:31 am
DUK: Dividend Analysis - Duke Energy Corporation
Duke Energy Corporation presents a solid opportunity for dividend investors due to its consistent dividend history and moderate growth. With a current dividend yield of 3.31%, it stands as a stable choice for income-seeking investors. Its extensive 44-year history of paying dividends and no recent cuts highlights its commitment to returning capital to shareholders.
📊 Overview
Duke Energy, operating within the utility sector, maintains a healthy dividend yield of 3.31% with its current dividend per share at $4.25. The company boasts a remarkable 44-year history of dividend payments, emphasizing its stability and investor trust, with no recent dividend cuts or suspensions.
| Detail | Value |
|---|---|
| Sector | Utilities |
| Dividend yield | 3.31 % |
| Current dividend per share | 4.25 USD |
| Dividend history | 44 years |
| Last cut or suspension | None |
📈 Dividend History
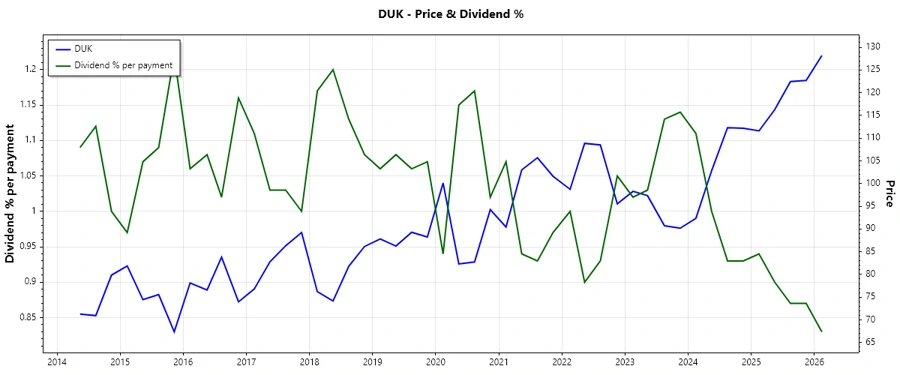
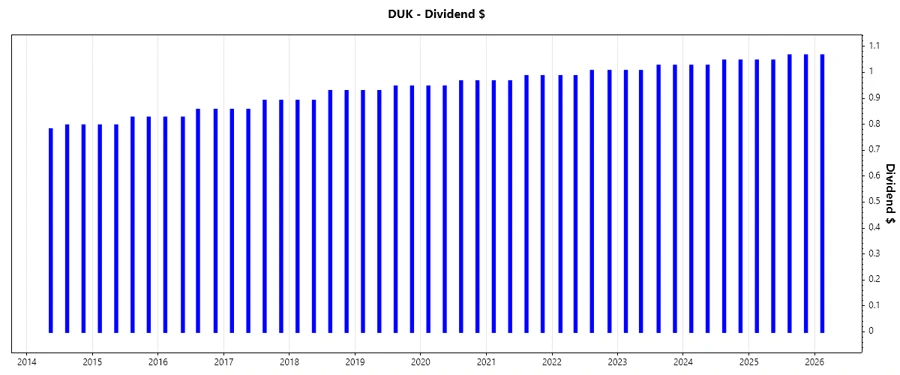
The dividend history of a company illustrates its reliability and the ability to generate consistent cash flow. Duke Energy's stable dividend increment pattern is evident over the decades, reflecting a sound financial strategy and favorable economic position.
| Year | Dividend per Share (USD) |
|---|---|
| 2026 | 1.065 |
| 2025 | 4.22 |
| 2024 | 4.14 |
| 2023 | 4.06 |
| 2022 | 3.98 |
📈 Dividend Growth
Dividend growth is a pivotal indicator of a company's financial health and the potential return for investors. Over the last 5 years, Duke Energy has shown a steady, albeit modest, dividend growth rate.
| Time | Growth |
|---|---|
| 3 years | 1.97 % |
| 5 years | 2.01 % |
The average dividend growth is 2.01 % over 5 years. This shows moderate but steady dividend growth.
📊 Payout Ratio
Payout ratios are essential for assessing how sustainable a company's dividends are relative to its earnings and cash flow. At 66.48% based on EPS and a 40.26% free cash flow payout ratio, Duke Energy demonstrates a balanced approach in maintaining its dividend obligations.
| Key figure | Ratio |
|---|---|
| EPS-based | 66.48 % |
| Free cash flow-based | 40.26 % |
With a balanced EPS payout ratio of 66.48%, Duke Energy effectively manages its resources to fund its dividends, ensuring sustainability and confirming its strategic financial management.
Cashflow & Capital Efficiency
Strong cash flow and capital efficiency reflect a company's capacity for capital allocation and sustainability of operations. Duke Energy's recent financial performance illustrates areas of focus needing attention for enhanced capital allocation.
| 2025 | 2024 | 2023 | |
|---|---|---|---|
| Free Cash Flow Yield | -0.018 | 0.0006 | -0.036 |
| Earnings Yield | 0.055 | 0.054 | 0.057 |
| CAPEX to Operating Cash Flow | 1.135 | 0.996 | 1.276 |
| Stock-based Compensation to Revenue | 0.000 | 0.000 | 0.000 |
| Free Cash Flow / Operating Cash Flow Ratio | -0.135 | 0.004 | -0.276 |
| Return on Invested Capital | 0.041 | 0.040 | 0.039 |
Duke Energy's capital efficiency indicates a struggle to convert investment into significant free cash flow, with a negative free cash flow yield. Improvements in financial control could enhance future investment returns.
Balance Sheet & Leverage Analysis
The robustness of Duke Energy's balance sheet is quintessential in evaluating its long-term financial health and risk exposure. Ratios like debt-to-equity provide insight into their leverage extent and financial risks.
| 2025 | 2024 | 2023 | |
|---|---|---|---|
| Debt-to-Equity | 1.753 | 1.700 | 1.638 |
| Debt-to-Assets | 0.464 | 0.457 | 0.455 |
| Debt-to-Capital | 0.637 | 0.630 | 0.621 |
| Net Debt to EBITDA | 5.783 | 5.662 | 5.785 |
| Current Ratio | 0.552 | 0.669 | 0.739 |
| Quick Ratio | 0.335 | 0.436 | 0.490 |
| Financial Leverage | 3.776 | 3.717 | 3.602 |
Leveraged at a moderate level, Duke Energy has maintained its debt in a manageable range, though a closer watch is advised on its leverage ratios for long-term sustainability.
Fundamental Strength & Profitability
Indicators such as return on equity and asset margins are crucial to determining Duke Energy's profitability and operational efficiency.
| 2025 | 2024 | 2023 | |
|---|---|---|---|
| Return on Equity | 0.096 | 0.090 | 0.087 |
| Return on Assets | 0.025 | 0.024 | 0.024 |
| Net Margin | 0.154 | 0.149 | 0.148 |
| EBIT Margin | 0.290 | 0.283 | 0.268 |
| EBITDA Margin | 0.486 | 0.494 | 0.477 |
| Gross Margin | 0.316 | 0.501 | 0.473 |
| R&D to Revenue | 0.000 | 0.000 | 0.000 |
Duke Energy's returns on equity and assets indicate moderate efficiency in using shareholder capital, and margin figures suggest sustained profitability with potential improvement scopes in operational efficiencies.
📉 Price Development
🗣️ Dividend Scoring System
| Criterion | Score | |
|---|---|---|
| Dividend yield | 3 | |
| Dividend Stability | 5 | |
| Dividend growth | 3 | |
| Payout ratio | 4 | |
| Financial stability | 3 | |
| Dividend continuity | 5 | |
| Cashflow Coverage | 3 | |
| Balance Sheet Quality | 3 |
Total Score: 29/40
🗣️ Rating
Duke Energy Corporation emerges as a steady option in the utility sector for dividend-seeking investors, supported by its robust dividend history and satisfactory payout ratios. While leverage levels call for close monitoring, its stable dividend trend and moderate growth potential justify a cautious but optimistic outlook.
Smart Data Insight
Master the Perfect Entry & Exit for this Stock
Don't leave your profits to chance. Historically, this stock follows specific seasonal patterns that institutional traders use to maximize returns.
- ✅ Identify the "Golden Buying Window"
- ✅ Avoid high-risk correction cycles
- ✅ Backtested data from the last 20+ years