January 14, 2026 a 03:31 pm
DUK: Dividend Analysis - Duke Energy Corporation
Duke Energy Corporation presents a robust dividend profile with a longstanding history of consistent payments. With over 44 years of dividend history and a compelling dividend yield, it remains an attractive choice for income-focused investors. The company's moderate dividend payout ratios suggest sustainability, while recent dividend growth reflects stable financial health. Despite some fluctuations, the dividend trajectory points towards steadiness, enhancing shareholder value over a prolonged period.
📊 Overview
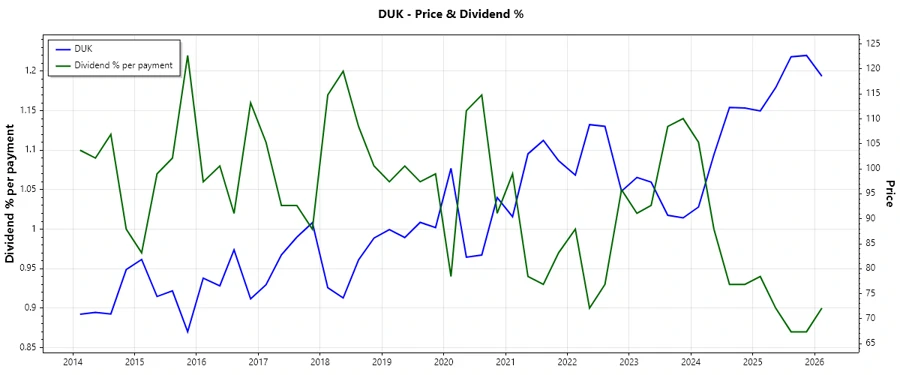
Duke Energy operates within the Utilities sector, crucial for its defensive characteristics amid market volatility. With a stable dividend yield of 3.61% and a current dividend of 4.16 USD per share, the company has maintained 44 years of dividend history without recent cuts or suspensions.
| Metric | Value |
|---|---|
| Sector | Utilities |
| Dividend yield | 3.61 % |
| Current dividend per share | 4.16 USD |
| Dividend history | 44 years |
| Last cut or suspension | None |
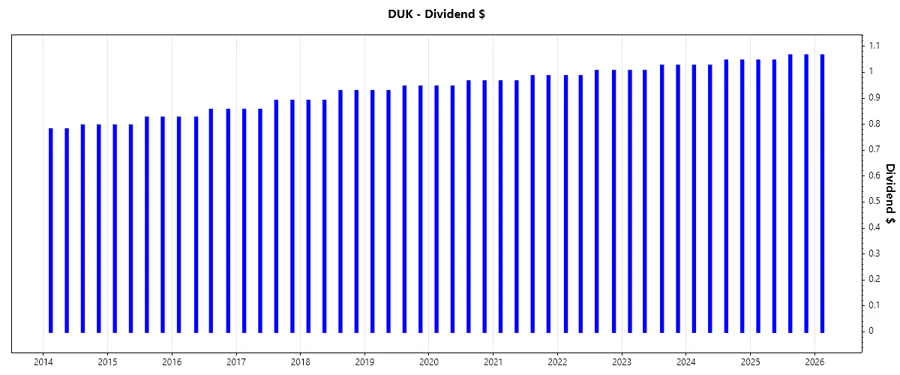
📜 Dividend History
A long dividend history is a strong indicator of Duke Energy's commitment to returning value to shareholders. This consistency reassures investors about future payouts, highlighting the company's resilience and financial stability. Monitoring dividend patterns can alert stakeholders to potential financial distress or growth opportunities.
| Year | Dividend Per Share (USD) |
|---|---|
| 2026 | 1.065 |
| 2025 | 4.220 |
| 2024 | 4.140 |
| 2023 | 4.060 |
| 2022 | 3.980 |
📈 Dividend Growth
The dividend growth metric is vital for assessing whether the company's dividend payments will keep pace with inflation and investor expectations. While past growth may not guarantee future increases, it significantly influences perceived company health and appeal to growth-oriented investors.
| Time | Growth |
|---|---|
| 3 years | 1.97 % |
| 5 years | 2.01 % |
The average dividend growth is 2.01% over 5 years. This demonstrates moderate but steady dividend growth, offering reliability and inflation protection to shareholders.
💰 Payout Ratio
The payout ratio, both EPS-based and FCF-based, indicate how much of the company's earnings and cash flow are used for dividend payments. A high payout ratio can be risky, suggesting limitations in reinvestments, while a reasonably balanced ratio reassures both yield stability and growth prospects.
| Key Figure | Ratio |
|---|---|
| EPS-based | 64.85 % |
| Free cash flow-based | 36.12 % |
The EPS-based payout ratio of 64.85% is moderate, indicating sustainable dividends with room for growth. The FCF-based level at 36.12% emphasizes that dividends are well covered by cash flow, supporting future distribution security and strategic business investments.
⚙️ Cashflow & Capital Efficiency
Cash flow and capital efficiency determine a company's ability to generate cash and utilize capital effectively for growth and shareholder returns. Fertility of free and operating cash flows indicates operational health and strategic effectiveness.
| Metric | 2024 | 2023 | 2022 |
|---|---|---|---|
| Free Cash Flow Yield | 0.06% | -3.64% | -6.86% |
| Earnings Yield | 5.42% | 5.74% | 3.22% |
| CAPEX to Operating Cash Flow | 25.64% | 127.60% | 191.78% |
| Stock-based Compensation to Revenue | 0.00% | 0.00% | 0.00% |
| Free Cash Flow / Operating Cash Flow Ratio | 0.39% | -27.597% | -91.78% |
Duke Energy shows potential for capital efficiency with challenges in converting cash flows to free cash flow. Sustained improvement in these areas can provide more confidence in future capital allocations and shareholder returns.
📊 Balance Sheet & Leverage Analysis
A company's leverage ratios indicate the structure of its debt and equity financing. Adequate leverage can enhance returns, but excessive leverage may pose solvency risks, making balance sheet strength crucial for ongoing stability and growth.
| Metric | 2024 | 2023 | 2022 |
|---|---|---|---|
| Debt-to-Equity | 1.70 | 1.64 | 1.52 |
| Debt-to-Assets | 45.74% | 45.48% | 42.06% |
| Debt-to-Capital | 62.97% | 62.10% | 60.30% |
| Net Debt to EBITDA | 5.61 | 5.78 | 6.03 |
| Current Ratio | 0.63 | 0.73 | 0.70 |
| Quick Ratio | 0.44 | 0.49 | 0.51 |
| Financial Leverage | 3.71 | 3.60 | 3.61 |
While debt levels are being managed, Duke Energy's continued focus on deleveraging and improving liquidity metrics will be advantageous for long-term solvency and financial flexibility.
🔍 Fundamental Strength & Profitability
Fundamental strength metrics reflect profitability, efficiency, and competitive positioning. Healthy margins and returns improvements indicate strong core operations and attractive future growth prospects.
| Metric | 2024 | 2023 | 2022 |
|---|---|---|---|
| Return on Equity | 8.99% | 8.75% | 5.17% |
| Return on Assets | 2.42% | 2.43% | 1.43% |
| Margins | 48.9% | 47.7% | 42.9% |
| EBIT Margin | 28.25% | 26.77% | 22.65% |
| Research & Development to Revenue | 0% | 0% | 0% |
Whilst R&D investments are absent, consistent returns and margins demonstrate effective asset utilization and profit generation, suggesting a focused strategy towards operational efficiency over innovation.
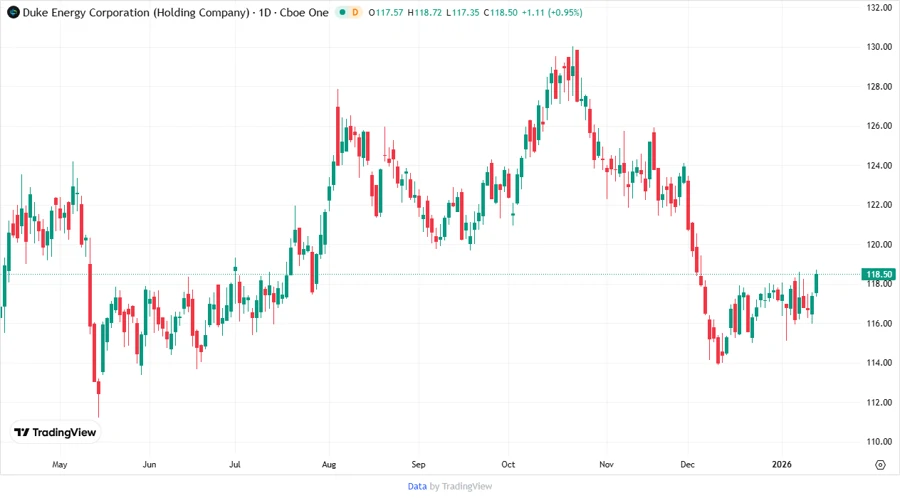
📉 Price Development
✒️ Dividend Scoring System
| Category | Score (1-5) | |
|---|---|---|
| Dividend yield | 4 | |
| Dividend Stability | 5 | |
| Dividend growth | 3 | |
| Payout ratio | 4 | |
| Financial stability | 3 | |
| Dividend continuity | 5 | |
| Cashflow Coverage | 3 | |
| Balance Sheet Quality | 3 |
Total Score: 30/40
⭐️ Rating
Duke Energy Corporation stands out with its robust dividend fundamentals and commitment to shareholder value, making it a suitable option for dividend-focused portfolios seeking both yields and stability. While improvements in leverage and cash flow generation are essential areas of focus, its record of stability and moderate growth supports a favorable investment outlook.