
June 17, 2026 a 08:15 am

DTE: Trend and Support & Resistance Analysis - DTE Energy Company
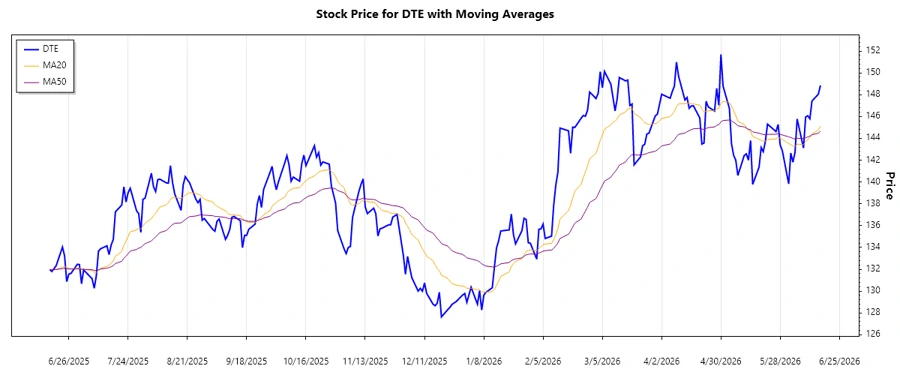
DTE Energy Company has shown mixed trends in recent months. Analyzing the historical data suggests the possibility of an uptrend as the EMA20 surpasses the EMA50. Key support and resistance zones have been identified, assisting in determining potential price movements. As a utility services company, DTE remains an essential player in the energy sector, leveraging diverse power generation sources to cater to its wide customer base in Michigan.
Trend Analysis
The DTE Energy Company's stock data indicates a potential recent uptrend with EMA20 exceeding EMA50. This suggests a bullish sentiment over the analyzed period.
| Date | Closing Price | Trend |
|---|---|---|
| 2026-06-16 | 148.85 | ▲ Uptrend |
| 2026-06-15 | 148.04 | ▲ Uptrend |
| 2026-06-12 | 147.42 | ▲ Uptrend |
| 2026-06-11 | 145.79 | ▲ Uptrend |
| 2026-06-10 | 146.07 | ▲ Uptrend |
| 2026-06-09 | 145.95 | ▲ Uptrend |
| 2026-06-08 | 143.11 | ▲ Uptrend |
Overall, the data suggests a bullish trend, primarily fueled by rising closing prices over the recent period.
Support- and Resistance
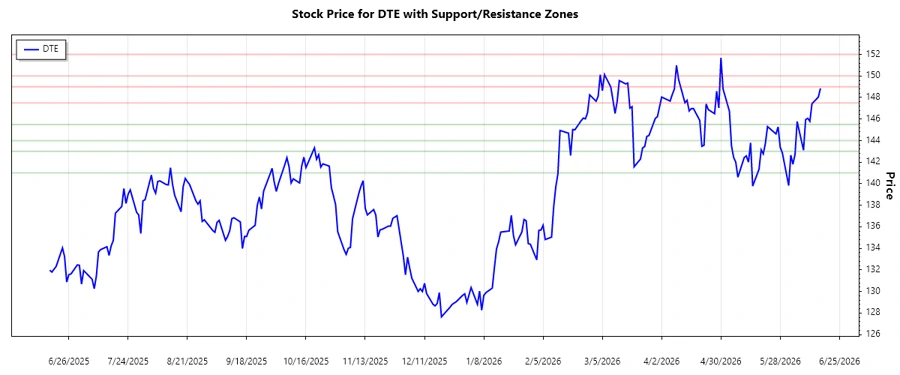
Through technical analysis of the closing prices, key support and resistance levels were identified for DTE Energy.
| Zone Type | From | To |
|---|---|---|
| Support 1 | 144.00 | 145.50 |
| Support 2 | 141.00 | 143.00 |
| Resistance 1 | 147.50 | 149.00 |
| Resistance 2 | 150.00 | 152.00 |
Currently, the price hovers around the resistance 1 zone, indicating potential difficulty in surpassing this level without significant buying pressure. This could signify a consolidation or pullback if not overcome soon.
Conclusion
The technical analysis of DTE Energy's stock suggests a potential bullish trend given the EMA analysis and closing prices. The existence of well-defined support and resistance zones further adds depth to existing trends. Near-term resistance suggests potential consolidation or pullback risks. An investor or analyst should monitor these zones closely, considering external factors such as economic policies and energy sector trends. Overall, DTE Energy presents opportunities for growth, yet with market volatility, risk management remains vital. Approach trading with caution and be ready for sudden changes.
json In this analysis, the recent stock performance of DTE Energy suggests a bullish trend supported by the moving averages. The stock price is near a key resistance level, presenting potential challenges for further growth without significant breakthroughs. Monitoring upcoming trends and support-resistance strategies will be crucial for investors.
Smart Data Insight
Master the Perfect Entry & Exit for this Stock
Don't leave your profits to chance. Historically, this stock follows specific seasonal patterns that institutional traders use to maximize returns.
- ✅ Identify the "Golden Buying Window"
- ✅ Avoid high-risk correction cycles
- ✅ Backtested data from the last 20+ years