April 19, 2026 a 02:03 pm
DTE: Trend and Support & Resistance Analysis - DTE Energy Company
DTE Energy Company is well-positioned in the utility sector, as evidenced by its consistent historical stock performance. With strong infrastructural assets, the company has a robust foundation, evidenced by recent pricing trends. Investors should consider both the technical indicators and the inherent market environment, including external utility demand influences. Assessing the current stock position can provide insights into future movements.
Trend Analysis
| Date | Close Price | Trend |
|---|---|---|
| 2026-04-17 | 146.98 | ▲ Uptrend |
| 2026-04-16 | 146.97 | ▲ Uptrend |
| 2026-04-15 | 146.75 | ▲ Uptrend |
| 2026-04-14 | 147.74 | ▲ Uptrend |
| 2026-04-13 | 147.51 | ▲ Uptrend |
| 2026-04-10 | 149.68 | ▲ Uptrend |
| 2026-04-09 | 150.98 | ▲ Uptrend |
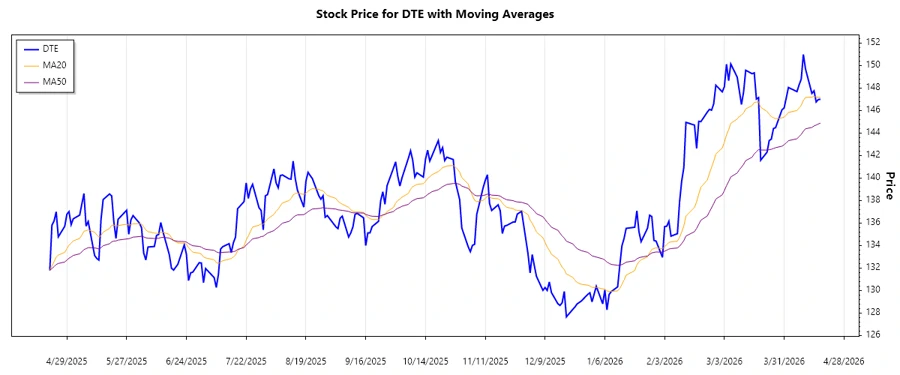
The trend analysis based on the EMA20 and EMA50 indicates a dominant uptrend, as the EMA20 is significantly higher than the EMA50. This suggests strong upward momentum in the stock price of DTE Energy. Investors are advised to watch for potential pullbacks which may present buying opportunities.
Support and Resistance
| Zone Type | Price Range ($) |
|---|---|
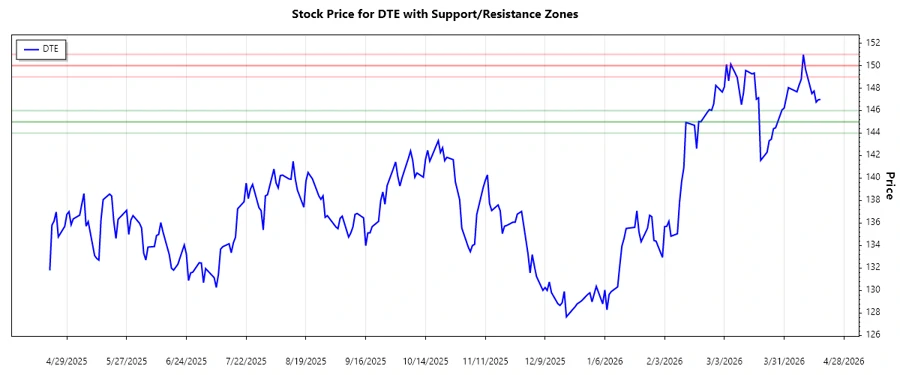
| Support Zone 1 | 145.00 ⇨ 146.00 |
| Support Zone 2 | 144.00 ⇨ 145.00 |
| Resistance Zone 1 | 149.00 ⇨ 150.00 |
| Resistance Zone 2 | 150.00 ⇨ 151.00 |
The current price appears to be approaching the Resistance Zone 1, suggesting that upward price momentum might face some challenges. Technical indicators suggest observing market reactions when key resistance levels are met.
Conclusion
DTE Energy’s stock currently demonstrates a robust uptrend, as supported by EMA indicators and recent price movements. The presence of reliable support zones provides a safety net for potential downward movements, while the nearing of resistance levels might suggest some pricing corrections. It's crucial for investors to weigh both growth potential and current price ceilings. Continuous monitoring of both global energy markets and company-specific events remains essential for an informed investment decision.