January 18, 2026 a 02:03 pm

DTE: Trend and Support & Resistance Analysis - DTE Energy Company
DTE Energy is currently showing a fluctuating trend with potential for moderate growth. The recent performance has illustrated both stability in its support zones and slight upward momentum. Investors might find this an interesting stock due to its moderate risk profile and strong business foundation. However, it remains crucial to monitor its resistance zones for any possible barriers to growth.
Trend Analysis
Analyzing the recent price movements for DTE Energy Company, the EMA20 indicator is above the EMA50, suggesting an ▲ uptrend over the observed period. However, given the proximity of the averages, caution is advised as short-term fluctuations may occur.
| Date | Close Price | Trend |
|---|---|---|
| 2026-01-16 | 135.51 | ▲ Uptrend |
| 2026-01-15 | 134.61 | ▲ Uptrend |
| 2026-01-14 | 133.95 | ▲ Uptrend |
| 2026-01-13 | 132.20 | ▲ Uptrend |
| 2026-01-12 | 130.31 | ▲ Uptrend |
| 2026-01-09 | 129.89 | ▲ Uptrend |
| 2026-01-08 | 129.63 | ▲ Uptrend |
The uptrend, as reflected by the moving averages, indicates investor bullishness. As long as the price remains elevated above the EMA50, this positive sentiment is expected to continue.
Support and Resistance
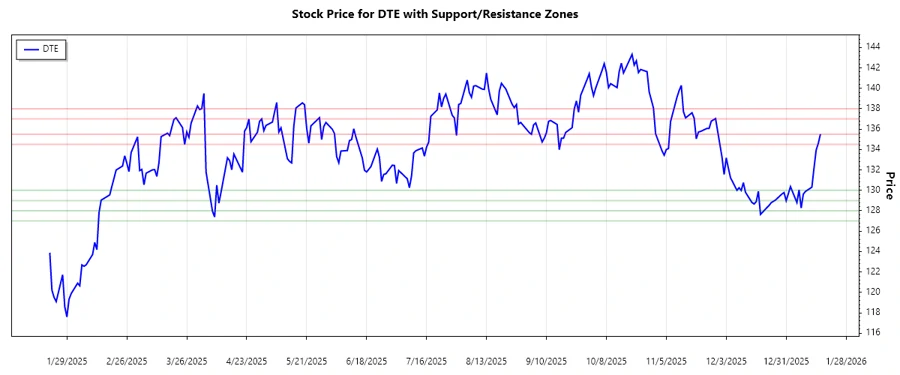
Through recent trading data, we have identified key support and resistance zones. The stock trades close to these zones, emphasizing their validity.
| Type | Zone From | Zone To |
|---|---|---|
| Support | 129.00 | 130.00 |
| Support | 127.00 | 128.00 |
| Resistance | 134.50 | 135.50 |
| Resistance | 137.00 | 138.00 |
The current price levels are within the first resistance zone, signaling potential short-term challenges but also opportunities if surpassed.
In conclusion, DTE Energy Company is exhibiting an upward trend within stable support and resistance frameworks. The stock reflects moderate growth potential with an investor-friendly risk profile due to its robust underlying businesses. Despite facing resistance levels, surpassing these zones might offer promising gains, making DTE an interesting choice for investors seeking solid utility stock options with a touch of growth potential. However, technical monitoring of the support and resistance dynamics is advised to mitigate risks effectively.