
May 28, 2026 a 08:00 am
DTE: Fundamental Ratio Analysis - DTE Energy Company
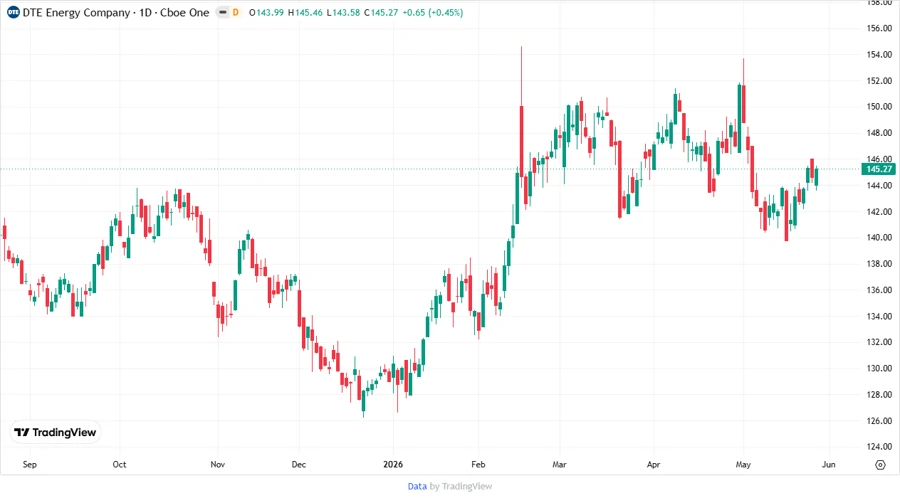
DTE Energy Company holds a stable position in the utilities sector, serving a substantial customer base in southeastern Michigan. The company boasts a diverse energy portfolio, including fossil-fuel, hydroelectric, and renewable sources. As a well-established firm since 1903, it offers an extensive network of energy transmission and distribution.
Fundamental Rating
The fundamental analysis rates DTE Energy Company with mixed scores, indicating some strengths and weaknesses in financial health.
| Category | Score | Visualization |
|---|---|---|
| Overall | C+ | |
| Discounted Cash Flow | 1 | |
| Return on Equity | 4 | |
| Return on Assets | 3 | |
| Debt to Equity | 1 | |
| Price to Earnings | 2 | |
| Price to Book | 2 |
Historical Rating
The historical data shows a relatively stable rating over time with some improvement seen recently.
| Date | Overall | DCF | ROE | ROA | D/E | P/E | P/B |
|---|---|---|---|---|---|---|---|
| 2026-05-27 | 2 | 1 | 4 | 3 | 1 | 2 | 2 |
| Previous | 0 | 1 | 4 | 3 | 1 | 2 | 2 |
Analyst Price Targets
Analysts indicate a positive outlook with price targets suggesting moderate growth potential.
| High | Low | Median | Consensus |
|---|---|---|---|
| $170 | $146 | $157.5 | $157.63 |
Analyst Sentiment
The consensus among analysts reflects a predominance of hold ratings, suggesting cautious optimism for the near term.
| Recommendation | Count | Distribution |
|---|---|---|
| Strong Buy | 0 | |
| Buy | 21 | |
| Hold | 25 | |
| Sell | 0 | |
| Strong Sell | 0 |
Conclusion
DTE Energy Company remains a solid player within the utilities sector despite facing some financial constraints. The company's diversified energy mix could serve as a buffer against volatile energy markets. However, its low debt to equity and price metrics suggest limited short-term financial flexibility. Analysts maintain a conservative outlook, further emphasizing a wait-and-see approach. The company’s future growth and stability may heavily rely on macroeconomic conditions and regulatory changes.
Smart Data Insight
Master the Perfect Entry & Exit for this Stock
Don't leave your profits to chance. Historically, this stock follows specific seasonal patterns that institutional traders use to maximize returns.
- ✅ Identify the "Golden Buying Window"
- ✅ Avoid high-risk correction cycles
- ✅ Backtested data from the last 20+ years