May 31, 2026 a 04:44 pm

DTE: Fibonacci Analysis - DTE Energy Company
DTE Energy Company's stock has shown resilience amidst fluctuating energy markets. As a longstanding provider of essential services such as electricity and natural gas in Michigan, the company benefits from steady demand. However, changes in policy and energy market volatility could impact future performance. Recent trends indicate a notable shift, which will be explored in the technical analysis below.
Fibonacci Analysis
| Detail | Date | Price (USD) |
|---|---|---|
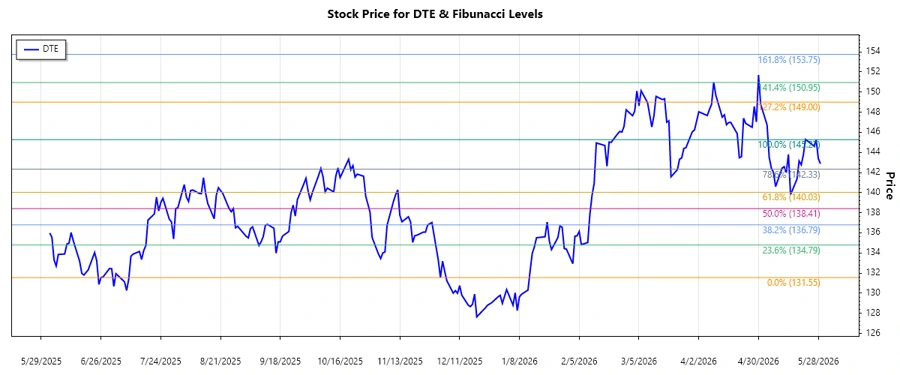
| Trend Start | 2025-12-02 | 131.55 |
| Trend End | 2026-05-27 | 145.27 |
| High Point | 2026-05-27 | 145.27 |
| Low Point | 2025-12-02 | 131.55 |
| Fibonacci Level | Price (USD) |
|---|---|
| 0.236 | 138.02 |
| 0.382 | 140.26 |
| 0.5 | 142.41 |
| 0.618 | 144.55 |
| 0.786 | 147.43 |
The current price closely aligns with the 0.618 retracement level, indicating that it lies within a significant retracement zone. As a critical level of support, it could suggest a continuation of the uptrend if maintained. A breach might indicate further downward adjustments.
Conclusion
DTE Energy’s stock showcases a general upward trend, with the current price gravitating around important Fibonacci levels. This positions the stock at a critical juncture, providing an opportunity for potential growth if the support holds. However, caution is advised as external economic factors and energy market dynamics could alter projections. Analysts should closely monitor this retracement zone, as a move below could signal new support levels whereas persistence above it may validate continued bullish sentiment. Overall, DTE’s stable operation in a necessary industry provides a cushion against market fluctuations.
Smart Data Insight
Master the Perfect Entry & Exit for this Stock
Don't leave your profits to chance. Historically, this stock follows specific seasonal patterns that institutional traders use to maximize returns.
- ✅ Identify the "Golden Buying Window"
- ✅ Avoid high-risk correction cycles
- ✅ Backtested data from the last 20+ years