November 14, 2025 a 06:44 am
DTE: Fibonacci Analysis - DTE Energy Company
DTE Energy Company, with its varied utility operations, provides electricity and natural gas to consumers across Michigan. The company has displayed a notable upward trend in stock prices over the past months, indicative of its strong market position and investor confidence. Current data exhibits strategic growth, bolstered by renewable energy initiatives and robust infrastructure developments.
Fibonacci Analysis
| Aspect | Detail |
|---|---|
| Trend Start Date | 2024-11-14 |
| Trend End Date | 2025-11-13 |
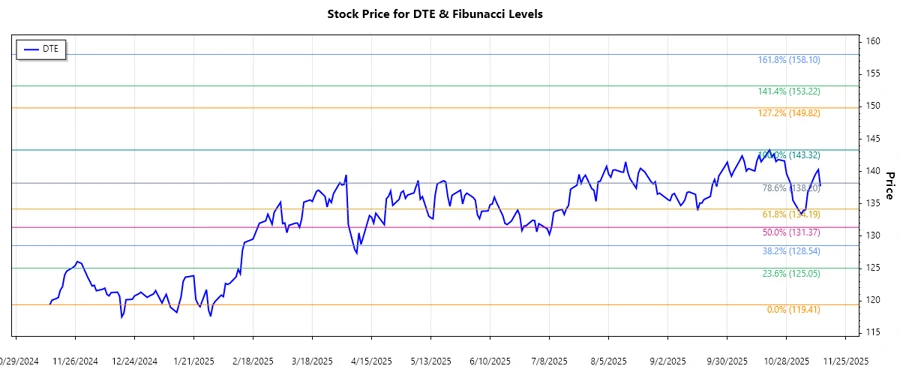
| High Price | $143.32 on 2025-10-20 |
| Low Price | $119.41 on 2024-11-14 |
| Current Price | $137.72 on 2025-11-13 |
| Fibonacci Levels | N/A |
| Fibonacci Level | Price |
|---|---|
| 0.236 | $124.87 |
| 0.382 | $128.94 |
| 0.5 | $131.37 |
| 0.618 | $133.80 |
| 0.786 | $137.56 |
The current price of $137.72 is within the 0.786 retracement area, signaling potential resistance. This level might act as a strong barrier, preventing an immediate rise and posing challenges for further upward momentum.
Conclusion
DTE Energy Company showcases a persisting uptrend and resilient financial health, highlighting potential investment opportunities. However, given the stock's proximity to key Fibonacci resistance levels, traders might anticipate a possible reversal or consolidation phase. Analyzing these signals could offer strategic insights into DTE's price actions. While investments in this company hold promise, potential fluctuations suggest cautious optimism.
Smart Data Insight
Master the Perfect Entry & Exit for this Stock
Don't leave your profits to chance. Historically, this stock follows specific seasonal patterns that institutional traders use to maximize returns.
- ✅ Identify the "Golden Buying Window"
- ✅ Avoid high-risk correction cycles
- ✅ Backtested data from the last 20+ years