September 16, 2025 a 10:15 am

DTE: Fibonacci Analysis - DTE Energy Company
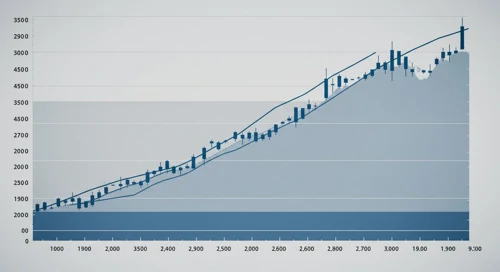
The DTE Energy Company stock demonstrated a noteworthy uptrend in recent months, driven by a robust performance in its utility operations. The company's focus on renewable assets and its diversified portfolio have contributed to investor confidence. However, market volatility and sector-specific challenges pose potential risks. This analysis will delve into the technical trends and potential price levels using Fibonacci retracement.
Fibonacci Analysis
| Start Date | End Date | High Date | High Price | Low Date | Low Price | Current Price | Trend Type |
|---|---|---|---|---|---|---|---|
| 2025-02-10 | 2025-09-15 | 2025-08-13 | 141.49 | 2025-02-10 | 123.71 | 136.45 | Uptrend |
| Retracement Level | Price Level |
|---|---|
| 0.236 | 136.93 |
| 0.382 | 134.97 |
| 0.5 | 132.60 |
| 0.618 | 130.23 |
| 0.786 | 126.77 |
The current price of 136.45 is within the 0.236 retracement level, indicating potential support at this level. This position suggests that if this support holds, further upward momentum could be expected.
Conclusion
The analysis indicates a favorable uptrend for DTE Energy Company, with prices currently retracing to key levels that may offer support. Holding above these levels could indicate a continuation of the bullish trend, aligned with the broader sectoral expansion into renewable energy. However, analysts should be cautious of potential pullbacks due to sector volatility. Investors might find appealing opportunities if the stock remains stable above the critical Fibonacci levels, as these can offer insight into market resilience. Risk mitigation strategies should include monitoring policy shifts and economic factors impacting utility companies globally.
Smart Data Insight
Master the Perfect Entry & Exit for this Stock
Don't leave your profits to chance. Historically, this stock follows specific seasonal patterns that institutional traders use to maximize returns.
- ✅ Identify the "Golden Buying Window"
- ✅ Avoid high-risk correction cycles
- ✅ Backtested data from the last 20+ years