May 13, 2026 a 03:31 pm

DTE: Dividend Analysis - DTE Energy Company
DTE Energy Company displays a consistent dividend history with a yield of 3.22%. As a key player in the utility sector, its stable dividend policy over 57 years underscores its commitment to shareholder returns. Despite recent challenges, the company's long-term prospects for dividend growth remain promising, though current payout ratios warrant close observation. This analysis delves into the various aspects of DTE Energy's dividend strategy.
📊 Overview
DTE Energy Company, a leader in the utilities sector, showcases a robust dividend yield of 3.22%. With a current dividend per share at USD 4.21, the company boasts a rich history of unbroken dividend payments over 57 years. However, stakeholders should be mindful of any potential disruptions, as the last declared cut or suspension was not stated.
| Attribute | Value |
|---|---|
| Sector | Utilities |
| Dividend yield | 3.22 % |
| Current dividend per share | 4.21 USD |
| Dividend history | 57 years |
| Last cut or suspension | None |
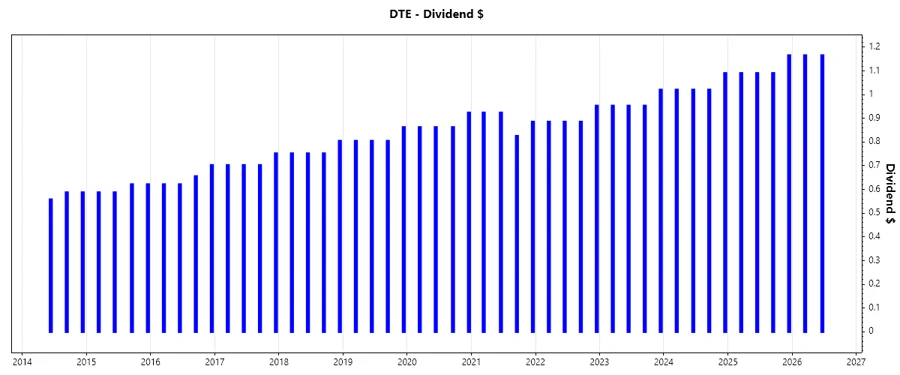
🗣️ Dividend History
The dividend history of DTE Energy Company reflects resilience and consistency, essential for investor confidence. Significant for strategic planning, this historical overview underscores the company's long-term viability. Below is a visual representation of the dividend payments.
| Year | Dividend per Share (USD) |
|---|---|
| 2026 | 2.33 |
| 2025 | 4.44 |
| 2024 | 4.15 |
| 2023 | 3.88 |
| 2022 | 3.61 |
📈 Dividend Growth
Tracking the dividend growth patterns over three and five years is crucial in assessing future performance. The data showcases moderate growth, highlighting DTE Energy's aim to increase shareholder value continuously.
| Time | Growth |
|---|---|
| 3 years | 7.13 % |
| 5 years | 4.79 % |
The average dividend growth is 4.79% over 5 years. This shows moderate but steady dividend growth, reflecting a gradual enhancement in shareholder wealth.
📉 Payout Ratio
The examination of payout ratios offers insights into the company's ability to sustain its dividend policies. A balanced approach towards earnings and cash flow allocations remains crucial for company stability.
| Key figure | Ratio |
|---|---|
| EPS-based | 68.85 % |
| Free cash flow-based | -59.47 % |
The EPS-based payout ratio at 68.85% suggests a cautious but manageable level of earnings distribution. In contrast, the concerning negative FCF-based payout ratio reflects financial challenges, signaling a need for strategic cash flow management.
✅ Cashflow & Capital Efficiency
Understanding cash flow yield and capital efficiency ratios are critical for evaluating the operational performance and capital allocation strategy of DTE Energy. Below, the data emphasizes these aspects across historical observations.
| 2025 | 2024 | 2023 |
|---|---|---|
| Free Cash Flow Yield: -3.75% | -3.30% | -3.14% |
| Earnings Yield: 5.48% | 5.61% | 6.15% |
| CAPEX to Operating Cash Flow: 129.24% | 122.62% | 122.17% |
| Stock-based Compensation to Revenue: 0% | 0% | 0% |
| Free Cash Flow / Operating Cash Flow Ratio: -29.24% | -22.62% | -22.17% |
The negative free cash flow yields and high CAPEX to operating cash flow percentage highlight ongoing investment and potential stress in liquidity management. Efficient capital allocation remains pivotal for DTE's strategic direction.
⚠️ Balance Sheet & Leverage Analysis
This section reviews the solvency ratios, debt levels, and balance sheet strength, which are pivotal for assessing financial health and risk management at DTE Energy. The scores here provide strategic insights for leveraging capabilities and risk preparedness.
| 2025 | 2024 | 2023 |
|---|---|---|
| Debt-to-Equity: 2.16 | 1.99 | 1.90 |
| Debt-to-Assets: 49.06% | 47.58% | 46.86% |
| Debt-to-Capital: 68.31% | 66.52% | 65.49% |
| Net Debt to EBITDA: 6.64 | 5.73 | 5.28 |
| Current Ratio: 0.80 | 0.70 | 0.60 |
| Quick Ratio: 0.80 | 0.46 | 0.42 |
| Financial Leverage: 4.39 | 4.18 | 4.05 |
The leverage indicators illustrate a robust, albeit leveraged, financial structure where efficiency improvements can enhance financial flexibility. The improving net debt to EBITDA ratio from 2023 to 2025 indicates gradual balance sheet fortification.
Fundamental Strength & Profitability
Assessing profitability margins and fundamental strength provides guidance on operational efficiency and growth capabilities within DTE Energy, showcasing its strategic ability to leverage assets and capital effectively.
| 2025 | 2024 | 2023 |
|---|---|---|
| Return on Equity: 11.88% | 11.98% | 12.64% |
| Return on Assets: 2.70% | 2.87% | 3.12% |
| Net Margin: 9.24% | 11.25% | 10.96% |
| EBIT Margin: 12.96% | 18.63% | 18.49% |
| EBITDA Margin: 25.03% | 32.53% | 31.09% |
| Gross Margin: 84.94% | 34.82% | 33.95% |
| R&D to Revenue: 0% | 0% | 0% |
The high margins and robust return on equity, especially in 2023, reflect an effectively managed business with potential for sustained growth, even without significant R&D expenditures.
Price Development
Dividend Scoring System
| Criteria | Score (1-5) | Score Bar |
|---|---|---|
| Dividend yield | 4 | |
| Dividend Stability | 4 | |
| Dividend growth | 3 | |
| Payout ratio | 3 | |
| Financial stability | 3 | |
| Dividend continuity | 5 | |
| Cashflow Coverage | 2 | |
| Balance Sheet Quality | 3 |
Overall Score: 27/40
Rating
In conclusion, DTE Energy Company presents as a reliable dividend-paying entity within the utility sector, with an impressive 57-year track record. While current financials call for careful cash flow oversight, its strong dividend history and moderate growth prospects offer a potentially secure investment for income-focused portfolios. The company maintains a balanced strategy with room for optimization in its operational efficiencies.
Smart Data Insight
Master the Perfect Entry & Exit for this Stock
Don't leave your profits to chance. Historically, this stock follows specific seasonal patterns that institutional traders use to maximize returns.
- ✅ Identify the "Golden Buying Window"
- ✅ Avoid high-risk correction cycles
- ✅ Backtested data from the last 20+ years