December 22, 2025 a 07:46 am
DTE: Dividend Analysis - DTE Energy Company
DTE Energy Company is a prime dividend stock for long-term investors seeking a steady income. With a robust dividend history spanning over five decades and a current yield of 3.44%, the stock presents a balanced blend of income and growth potential. However, the balance between earnings and dividends needs monitoring, particularly with an EPS payout ratio over 80%.
📊 Overview
DTE Energy operates within a stable sector, focusing on delivering shareholder value through consistent dividends. The company's current dividend yield stands at 3.44%, with a notable 56-year history of dividend distributions.
| Sector | Dividend Yield | Current Dividend per Share | Dividend History | Last Cut or Suspension |
|---|---|---|---|---|
| Utilities | 3.44% | 3.91 USD | 56 years | 2000 |
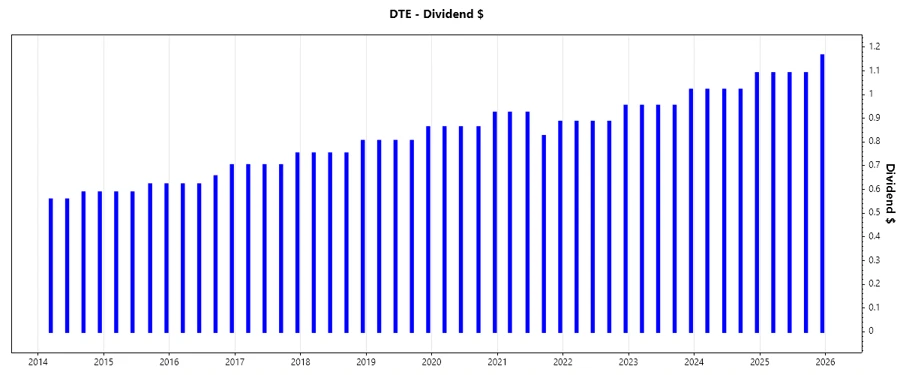
🗣️ Dividend History
The historical consistency of DTE Energy's dividend payments underscores its commitment to shareholder returns. This longstanding dividend history is a testament to the company's stable cash flow generation in a traditionally reliable sector.
| Year | Dividend per Share (USD) |
|---|---|
| 2025 | 4.435 |
| 2024 | 4.15 |
| 2023 | 3.8775 |
| 2022 | 3.6075 |
| 2021 | 3.5568 |
📈 Dividend Growth
DTE Energy Company has demonstrated steady dividend growth over the past three and five years, reflecting the firm's strategic commitment to shareholder value even amid fluctuating market conditions.
| Time | Growth |
|---|---|
| 3 years | 5.28% |
| 5 years | 4.85% |
The average dividend growth is 4.85% over 5 years. This shows moderate but steady dividend growth.
💼 Payout Ratio
Payout ratios are crucial in assessing dividend sustainability. DTE Energy's EPS-based payout ratio hovers at 83.68%, indicating a high distribution of earnings as dividends, while the free cash flow payout ratio is a more conservative 47.83%.
| Key Figure | Ratio |
|---|---|
| EPS-based | 83.68% |
| Free cash flow-based | 47.83% |
The EPS payout ratio suggests a significant portion of profits are returned to shareholders, which can limit reinvestment potential. However, the FCF payout ratio indicates more room for growth and investment expansion.
📉 Cashflow & Capital Efficiency
Analyzing cash flow showcases DTE Energy's operational efficiency. The stability of cash flows and capital utilization are critical to sustaining dividend policies and supporting long-term value creation.
| Metric | 2024 | 2023 | 2022 |
|---|---|---|---|
| Free Cash Flow Yield | -3.30% | -3.14% | -6.11% |
| Earnings Yield | 5.62% | 6.15% | 4.72% |
| CAPEX to Operating Cash Flow | 122.62% | 122.17% | 170.86% |
| Stock-Based Compensation to Revenue | 0% | 0% | 0% |
| Free Cash Flow / Operating Cash Flow Ratio | -22.62% | -22.17% | -70.86% |
The negative free cash flow yield requires close examination. Despite strong earnings yields, high CAPEX levels relative to operating cash flow signal potential challenges in cash flow stability that investors should monitor closely.
💼 Balance Sheet & Leverage Analysis
Examining leverage ratios provides insight into DTE Energy's financial risk and stability. Balancing debt levels is crucial for sustaining dividend programs and ensuring long-term operational flexibility.
| Metric | 2024 | 2023 | 2022 |
|---|---|---|---|
| Debt-to-Equity | 198.66% | 189.77% | 185.05% |
| Debt-to-Assets | 47.58% | 46.86% | 45.08% |
| Debt-to-Capital | 66.52% | 65.49% | 64.92% |
| Net Debt to EBITDA | 5.73 | 5.28 | 5.90 |
| Current Ratio | 0.71 | 0.60 | 0.81 |
| Quick Ratio | 0.46 | 0.42 | 0.63 |
| Financial Leverage | 4.18 | 4.05 | 4.11 |
Though financial leverage is considerable, the coverage and quick ratios display a precautionary buffer against short-term obligations. Investors should remain vigilant as net debt remains elevated relative to EBITDA.
✅ Fundamental Strength & Profitability
DTE Energy's profitability and operational efficiency metrics provide a snapshot of its ability to generate returns and sustain its dividend policy effectively.
| Metric | 2024 | 2023 | 2022 |
|---|---|---|---|
| Return on Equity | 12.00% | 12.64% | 10.42% |
| Return on Assets | 2.87% | 3.12% | 2.54% |
| Return on Invested Capital | 4.65% | 4.73% | 4.28% |
| Net Profit Margin | 11.27% | 10.96% | 5.63% |
| Gross Profit Margin | 34.82% | 33.95% | 19.08% |
| EBIT Margin | 18.63% | 18.49% | 9.29% |
| EBITDA Margin | 32.54% | 31.09% | 16.93% |
| Research & Development to Revenue | 0% | 0% | 0% |
The profitability metrics suggest substantial internal generation capability. However, the lack of R&D investment could limit future growth opportunities.
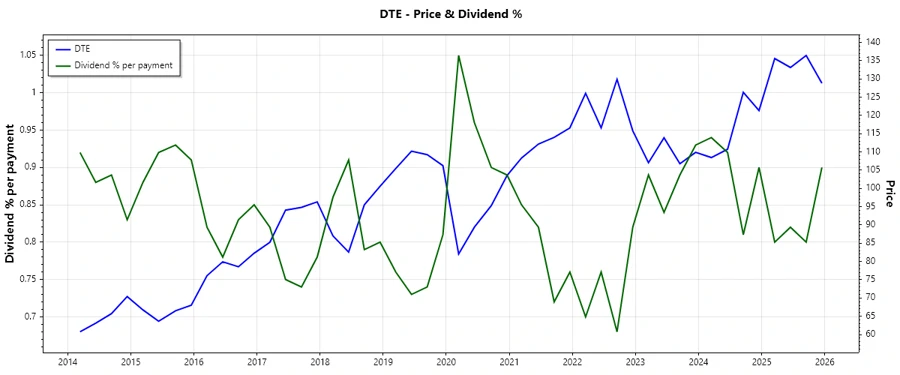
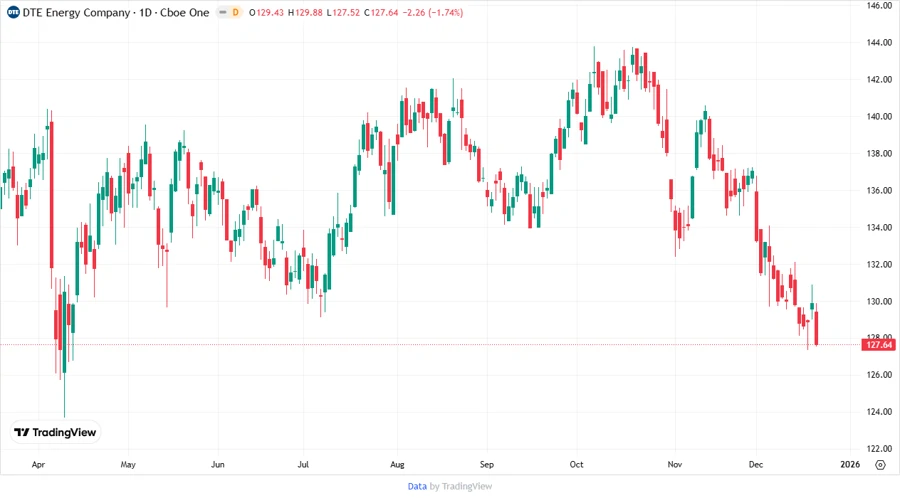
📈 Price Development
🔵 Dividend Scoring System
| Category | Score (out of 5) | Score Bar |
|---|---|---|
| Dividend yield | 4 | |
| Dividend stability | 5 | |
| Dividend growth | 3 | |
| Payout ratio | 3 | |
| Financial stability | 3 | |
| Dividend continuity | 5 | |
| Cashflow coverage | 2 | |
| Balance sheet quality | 3 |
Overall Score: 28 / 40
🔍 Rating
DTE Energy Company demonstrates exceptional dividend stability and has a consistent growth trajectory. While the high payout ratio and current cash flow challenges suggest caution, the company's robust history and sector predictability warrant a cautious but hopeful investment view. It is recommended for conservative investors focusing on long-term income stability.