December 02, 2025 a 07:46 am
DTE: Dividend Analysis - DTE Energy Company
DTE Energy Company presents a resilient profile, standing on a strong foundation of a robust dividend history and steady growth. With a dividend yield of approximately 3.2%, it offers an attractive return to income-focused investors. The company's dedication to sustaining dividends over 56 years, without recent cuts, indicates commendable financial management, appealing to both conservative and growth-oriented portfolios.
📊 Overview
DTE Energy Company exhibits a solid dividend profile with consistent payout and steady growth.
| Category | Information |
|---|---|
| Sector | Utilities |
| Dividend yield | 3.20% |
| Current dividend per share | 3.91 USD |
| Dividend history | 56 years |
| Last cut or suspension | None |
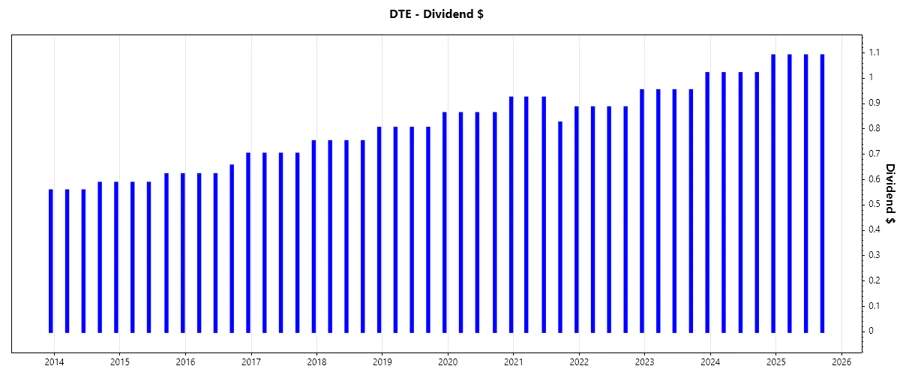
📈 Dividend History
The company's steadfast dividend history is a testament to its operational efficiency and financial discipline.
| Year | Dividend Per Share (USD) |
|---|---|
| 2025 | 3.27 |
| 2024 | 4.15 |
| 2023 | 3.88 |
| 2022 | 3.61 |
| 2021 | 3.56 |
📈 Dividend Growth
DTE reflects a consistent dividend growth pattern, enhancing investor confidence even amidst economic fluctuations.
| Time | Growth |
|---|---|
| 3 years | 5.28% |
| 5 years | 4.85% |
The average dividend growth is 4.85% over 5 years. This shows moderate but steady dividend growth.
⚠️ Payout Ratio
The payout ratio is a crucial indicator of dividend sustainability, directly influencing future payout strategies.
| Key figure | Ratio |
|---|---|
| EPS-based | 83.68% |
| Free cash flow-based | 47.83% |
The EPS payout ratio of 83.68% suggests a high payout proportion, yet the lower FCF payout ratio at 47.83% indicates manageable dividend outflows, balancing reinvestment and shareholder returns.
✅ Cashflow & Capital Efficiency
Cash flow stability and capital efficiency are vital for ongoing operational investments and dividend payments.
| Metric | 2023 | 2024 |
|---|---|---|
| Free Cash Flow Yield | -3.14% | -3.30% |
| Earnings Yield | 6.15% | 5.62% |
| CAPEX to Operating Cash Flow | 122.17% | 122.62% |
| Stock-based Compensation to Revenue | 0% | 0% |
| Free Cash Flow / Operating Cash Flow Ratio | -22.17% | -22.62% |
The negative free cash flow yield reflects potential cash management challenges, which need addressing to maintain dividend stability and capital efficiency.
📉 Balance Sheet & Leverage Analysis
Analyzing balance sheet strength and leverage offers insights into financial security against economic uncertainties.
| Metrics | 2023 | 2024 |
|---|---|---|
| Debt-to-Equity | 1.90 | 1.99 |
| Debt-to-Assets | 46.86% | 47.58% |
| Debt-to-Capital | 65.49% | 66.52% |
| Net Debt to EBITDA | 5.28 | 5.73 |
| Current Ratio | 0.60 | 0.71 |
| Quick Ratio | 0.42 | 0.46 |
| Financial Leverage | 4.05 | 4.18 |
The analysis points towards high leverage, signaling caution and the need for strategic debt management to uphold financial flexibility.
✅ Fundamental Strength & Profitability
Profitability metrics highlight core operational efficiency, essential for strategic growth and dividend assurance.
| Metric | 2023 | 2024 |
|---|---|---|
| Return on Equity | 12.64% | 12.00% |
| Return on Assets | 3.12% | 2.87% |
| Net Margin | 10.96% | 11.27% |
| EBIT Margin | 18.49% | 18.63% |
| EBITDA Margin | 31.09% | 32.54% |
| Gross Margin | 33.95% | 34.82% |
The fundamental strengths unveil robust profitability, lending assurance towards a sustainable dividend policy amidst operational challenges.
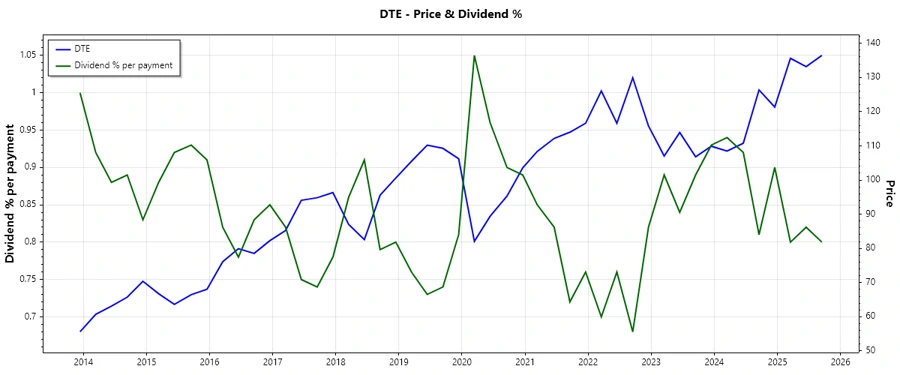
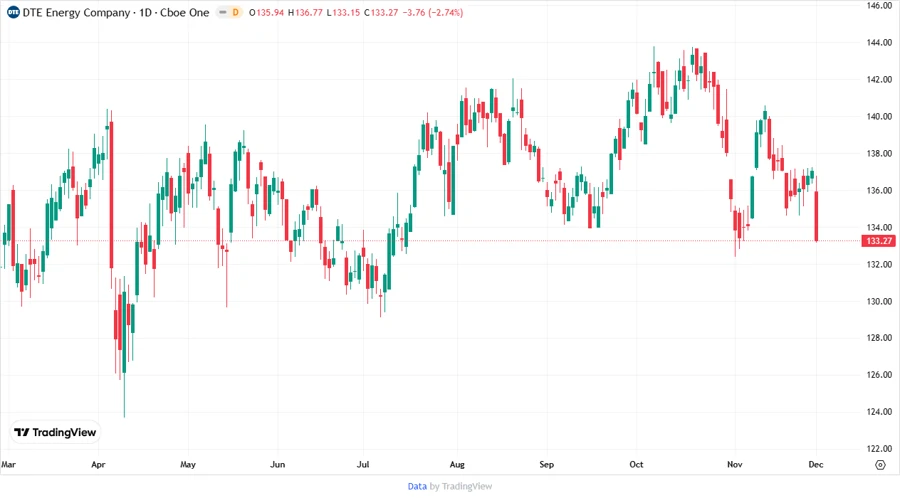
📊 Price Development
✅ Dividend Scoring System
| Criteria | Score | Score Bar |
|---|---|---|
| Dividend yield | 4 | |
| Dividend Stability | 5 | |
| Dividend growth | 3 | |
| Payout ratio | 3 | |
| Financial stability | 3 | |
| Dividend continuity | 5 | |
| Cashflow Coverage | 2 | |
| Balance Sheet Quality | 3 |
Total Score: 28/40
✅ Rating
In conclusion, DTE Energy Company exhibits a robust dividend profile, buttressed by a history of consistent payouts and a commendable yield. While certain areas like financial leverage and cash flow coverage require close monitoring, the stable dividend trend remains confident. Consequently, DTE is recommended for investors seeking reliable income returns within the utilities sector.