HRL: Analysts Ratings - Hormel Foods Corporation
HRL: Comprehensive breakdown of current and historical analyst ratings, offering insights into how expert sentiment has evolved over time.
May 23, 2026 a 04:38 pm
TSCO: Fundamental Ratio Analysis - Tractor Supply Company

TSCO: Evaluation of key financial ratios, analyst ratings, and price targets. A data-driven perspective on the valuation and market expectations.
May 23, 2026 a 03:43 pm
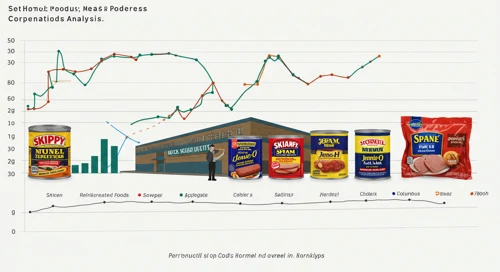
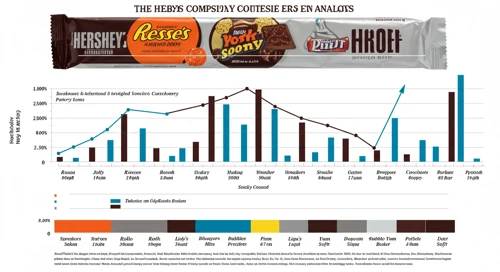
Consumer Staples Comparison. 23 May

Comparison of Consumer Staples. Where is strength and weakness? What has developed well and badly?
May 23, 2026 a 03:31 pm
UNP: Fibunacci Level Technical Analysis - Union Pacific Corporation
UNP: Fibonacci retracement levels to identify key potential support and resistance zones, based on recent price trends.
May 23, 2026 a 03:15 pm
KHC: Trend with Support and Resistance Levels - The Kraft Heinz Company
KHC: Current price trend is evaluated alongside key support and resistance level. View of potential turning points and price momentum.
May 23, 2026 a 02:03 pm
AES: Trend with Support and Resistance Levels - The AES Corporation
AES: Current price trend is evaluated alongside key support and resistance level. View of potential turning points and price momentum.
May 23, 2026 a 01:15 pm
XEL: Analysts Ratings - Xcel Energy Inc
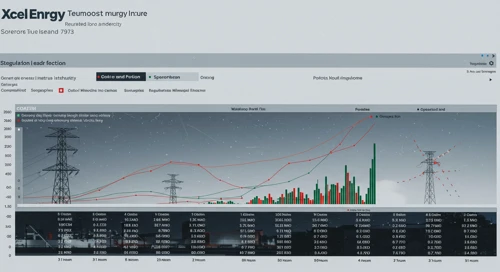
XEL: Comprehensive breakdown of current and historical analyst ratings, offering insights into how expert sentiment has evolved over time.
May 23, 2026 a 01:00 pm
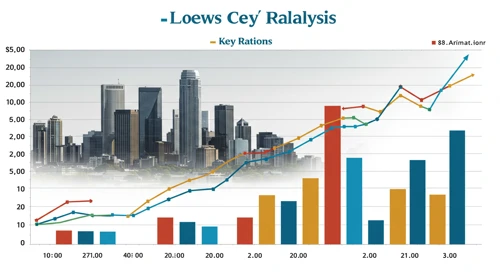
L: Fundamental Ratio Analysis - Loews Corporation
May 23, 2026 a 07:43 pm
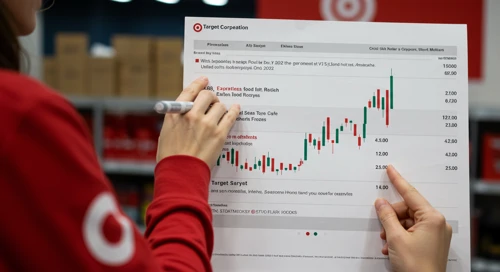
TGT: Fundamental Ratio Analysis - Target Corporation
May 23, 2026 a 06:00 pm

SYF: Analysts Ratings - Synchrony Financial
May 23, 2026 a 05:00 pm
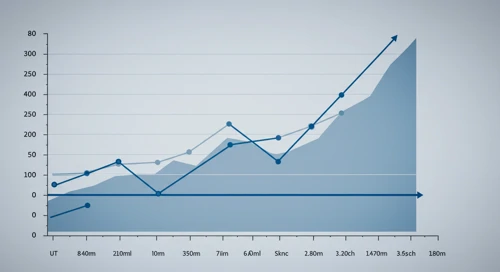
PFG: Fibunacci Level Technical Analysis - Principal Financial Group Inc
May 23, 2026 a 04:44 pm
JPM: Fundamental Ratio Analysis - JPMorgan Chase and Co

JPM: Evaluation of key financial ratios, analyst ratings, and price targets. A data-driven perspective on the valuation and market expectations.
May 23, 2026 a 01:00 pm
KEYS: Analysts Ratings - Keysight Technologies Inc
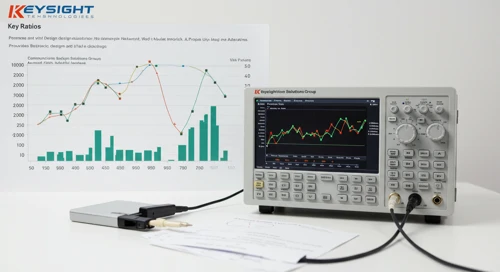
KEYS: Comprehensive breakdown of current and historical analyst ratings, offering insights into how expert sentiment has evolved over time.
May 23, 2026 a 12:38 pm
Crypto Comparison. 23 May

Comparison of Crypto. Where is strength and weakness? What has developed well and badly?
May 23, 2026 a 12:31 pm
LULU: Fibunacci Level Technical Analysis - Lululemon Athletica Inc

LULU: Fibonacci retracement levels to identify key potential support and resistance zones, based on recent price trends.
May 23, 2026 a 11:44 am
REG: Fundamental Ratio Analysis - Regency Centers Corporation
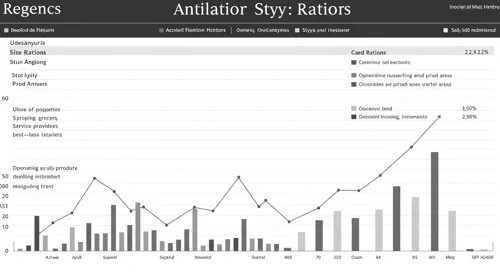
REG: Evaluation of key financial ratios, analyst ratings, and price targets. A data-driven perspective on the valuation and market expectations.
May 23, 2026 a 11:43 am
CASY: Fibunacci Level Technical Analysis - Caseys General Stores Inc

CASY: Fibonacci retracement levels to identify key potential support and resistance zones, based on recent price trends.
May 23, 2026 a 10:15 am
Industrial Comparison. 23 May

Comparison of Industrial. Where is strength and weakness? What has developed well and badly?
May 23, 2026 a 09:31 am
Stock Market - Heatmap
Use mouse wheel to zoom in and out. Click a ticker to display detailed information in a new window. Hover mouse cursor over a ticker to see more data.
Stock's
VST: Fundamental Ratio Analysis - Vistra Corp
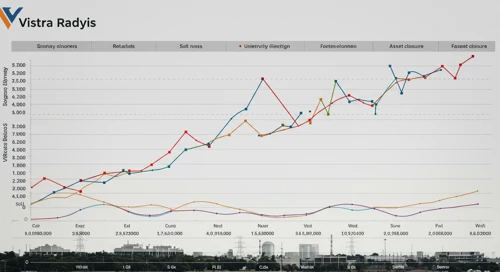
VST: Evaluation of key financial ratios, analyst ratings, and price targets. A data-driven perspective on the valuation and market expectations.
May 23, 2026 a 08:00 am
ETR: Dividend Analysis - Entergy Corporation
ETR: In-depth analysis of a company's dividend stability and key fundamental ratios to assess its financial strength and long-term investment potential.
May 23, 2026 a 07:46 am
JBHT: Fundamental Ratio Analysis - JB Hunt Transport Services Inc

JBHT: Evaluation of key financial ratios, analyst ratings, and price targets. A data-driven perspective on the valuation and market expectations.
May 23, 2026 a 07:43 am
MDT: Dividend Analysis - Medtronic plc
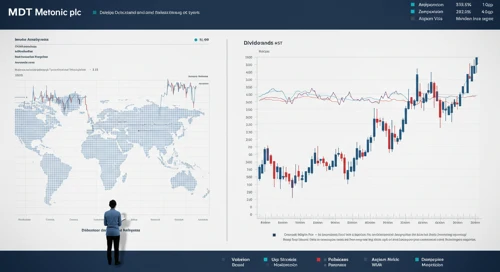
MDT: In-depth analysis of a company's dividend stability and key fundamental ratios to assess its financial strength and long-term investment potential.
May 23, 2026 a 07:31 am
SOLV: Fibunacci Level Technical Analysis - Solventum Corporation

SOLV: Fibonacci retracement levels to identify key potential support and resistance zones, based on recent price trends.
May 23, 2026 a 06:44 am
SATS: Fibunacci Level Technical Analysis - EchoStar Corporation
SATS: Fibonacci retracement levels to identify key potential support and resistance zones, based on recent price trends.
May 23, 2026 a 05:15 am
IVZ: Trend with Support and Resistance Levels - Invesco Ltd
IVZ: Current price trend is evaluated alongside key support and resistance level. View of potential turning points and price momentum.
May 23, 2026 a 04:03 am
CTAS: Trend with Support and Resistance Levels - Cintas Corporation
May 23, 2026 a 09:03 am
HSY: Analysts Ratings - The Hershey Company
May 23, 2026 a 09:00 am

VICI: Analysts Ratings - VICI Properties Inc
May 23, 2026 a 08:38 am
PKG: Trend with Support and Resistance Levels - Packaging Corporation of America
May 23, 2026 a 08:15 am
PEG: Trend with Support and Resistance Levels - Public Service Enterprise Group Incorporated
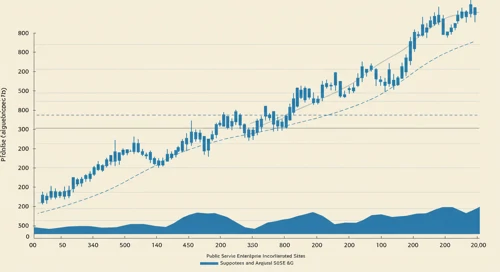
PEG: Current price trend is evaluated alongside key support and resistance level. View of potential turning points and price momentum.
May 23, 2026 a 03:15 am
NUE: Dividend Analysis - Nucor Corporation
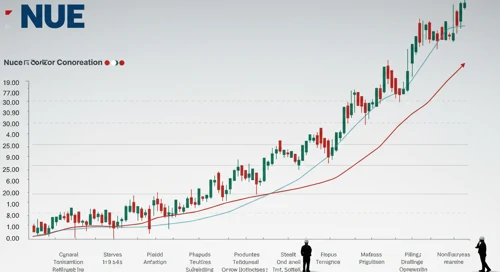
NUE: In-depth analysis of a company's dividend stability and key fundamental ratios to assess its financial strength and long-term investment potential.
May 23, 2026 a 02:46 am
BDX: Analysts Ratings - Becton Dickinson and Company
BDX: Comprehensive breakdown of current and historical analyst ratings, offering insights into how expert sentiment has evolved over time.
May 22, 2026 a 09:00 pm
PLD: Analysts Ratings - Prologis Inc

PLD: Comprehensive breakdown of current and historical analyst ratings, offering insights into how expert sentiment has evolved over time.
May 22, 2026 a 08:38 pm
TPR: Fundamental Ratio Analysis - Tapestry Inc
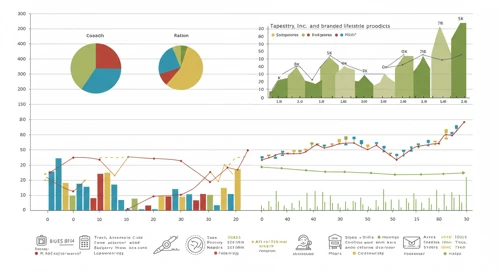
TPR: Evaluation of key financial ratios, analyst ratings, and price targets. A data-driven perspective on the valuation and market expectations.
May 22, 2026 a 07:43 pm
AVY: Fundamental Ratio Analysis - Avery Dennison Corporation
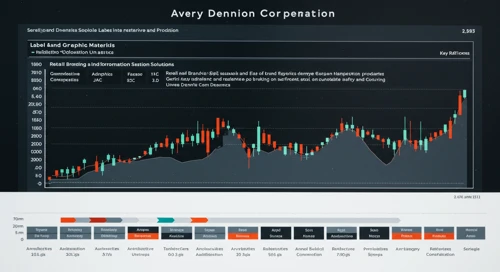
AVY: Evaluation of key financial ratios, analyst ratings, and price targets. A data-driven perspective on the valuation and market expectations.
May 22, 2026 a 06:01 pm
DLTR: Analysts Ratings - Dollar Tree Inc

DLTR: Comprehensive breakdown of current and historical analyst ratings, offering insights into how expert sentiment has evolved over time.
May 22, 2026 a 05:00 pm
Economic Calendar
Currencies
AUDCAD: Trend with Support and Resistance Levels
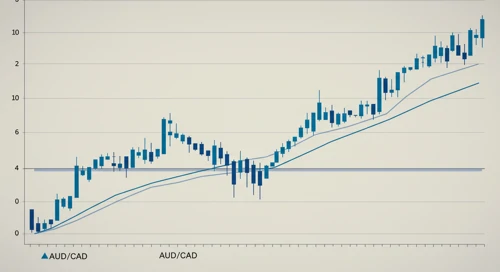
AUDCAD: Current price trend is evaluated alongside key support and resistance level. View of potential turning points and price momentum.
May 22, 2026 a 04:28 am
Todays Important Key Figures 21 May
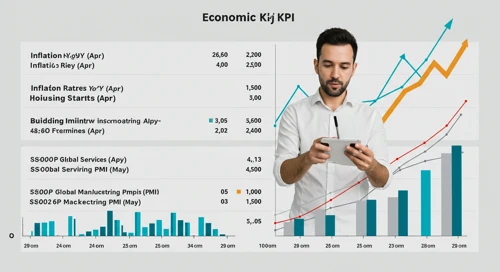
Today’s important economic data releases – a snapshot of key indicators influencing markets and shaping financial expectations.
May 21, 2026 a 07:00 pm
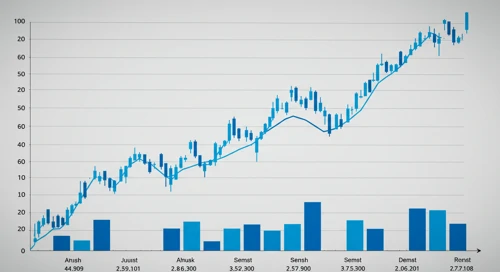
EURAUD: Fibunacci Level Technical Analysis
EURAUD: Fibonacci retracement levels to identify key potential support and resistance zones, based on recent price trends.
May 21, 2026 a 05:08 am
AUDJPY: Trend with Support and Resistance Levels
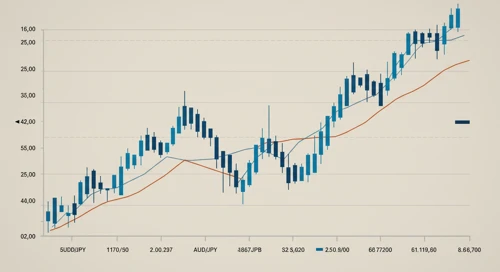
AUDJPY: Current price trend is evaluated alongside key support and resistance level. View of potential turning points and price momentum.
May 21, 2026 a 04:28 am
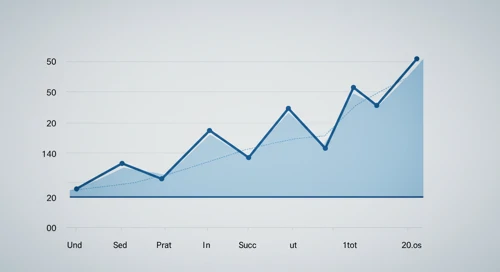
Important Key Figures of the last Days

Overview of key economic indicators released over the past days, highlighting their potential impact on markets and investor sentiment.
May 21, 2026 a 02:31 am
Todays Important Key Figures 20 May

Today’s important economic data releases – a snapshot of key indicators influencing markets and shaping financial expectations.
May 20, 2026 a 07:00 pm
CADCHF: Fibunacci Level Technical Analysis
CADCHF: Fibonacci retracement levels to identify key potential support and resistance zones, based on recent price trends.
May 20, 2026 a 05:08 am
AUDNZD: Fibunacci Level Technical Analysis
May 23, 2026 a 05:08 am

Todays Important Key Figures 23 May
May 22, 2026 a 11:00 pm

Todays Important Key Figures 22 May
May 22, 2026 a 07:00 pm
USDJPY: Fibunacci Level Technical Analysis
May 22, 2026 a 05:08 am
Todays Important Key Figures 19 May

Today’s important economic data releases – a snapshot of key indicators influencing markets and shaping financial expectations.
May 19, 2026 a 07:00 pm
CADJPY: Fibunacci Level Technical Analysis
CADJPY: Fibonacci retracement levels to identify key potential support and resistance zones, based on recent price trends.
May 19, 2026 a 05:08 am
EURJPY: Trend with Support and Resistance Levels
EURJPY: Current price trend is evaluated alongside key support and resistance level. View of potential turning points and price momentum.
May 19, 2026 a 04:28 am
Important Key Figures of the last Days

Overview of key economic indicators released over the past days, highlighting their potential impact on markets and investor sentiment.
May 19, 2026 a 02:31 am
Todays Important Key Figures 18 May
Today’s important economic data releases – a snapshot of key indicators influencing markets and shaping financial expectations.
May 18, 2026 a 07:00 pm
NZDCHF: Fibunacci Level Technical Analysis
NZDCHF: Fibonacci retracement levels to identify key potential support and resistance zones, based on recent price trends.
May 18, 2026 a 05:08 am
EURCHF: Trend with Support and Resistance Levels
EURCHF: Current price trend is evaluated alongside key support and resistance level. View of potential turning points and price momentum.
May 18, 2026 a 04:28 am
Currencies