
July 11, 2026 a 07:43 pm
DRI: Fundamental Ratio Analysis - Darden Restaurants, Inc.
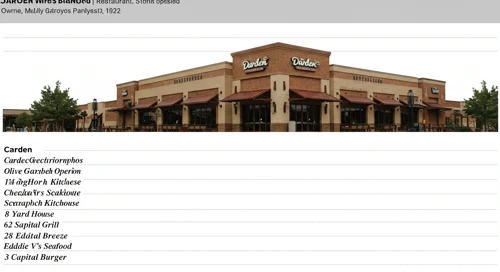
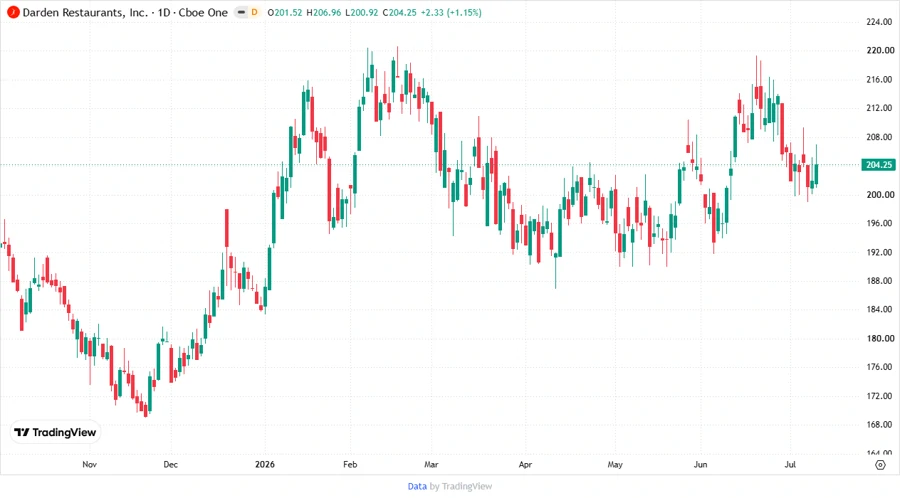
Darden Restaurants, Inc. (Ticker: DRI) has shown steady performance in the restaurant industry, with a strong presence in both the U.S. and Canada. The company has maintained a robust portfolio of full-service dining establishments, benefiting from its well-known brands and consistent market demand.
Fundamental Rating
Darden Restaurants, Inc. holds a solid B+ rating, reflecting its balanced financial metrics and competitive market position.
| Category | Score | Visualization |
|---|---|---|
| Discounted Cash Flow (DCF) | 4 | |
| Return on Equity (ROE) | 5 | |
| Return on Assets (ROA) | 5 | |
| Debt to Equity | 1 | |
| Price to Earnings (P/E) | 3 | |
| Price to Book (P/B) | 1 |
Historical Rating
The historical scores depict consistency in most financial metrics, allowing for strategic planning and forecasting.
| Date | Overall Score | DCF | ROE | ROA | Debt/Equity | P/E | P/B |
|---|---|---|---|---|---|---|---|
| 2026-07-10 | 3 | 4 | 5 | 5 | 1 | 3 | 1 |
| Previous Date | 0 | 4 | 5 | 5 | 1 | 3 | 1 |
Analyst Price Targets
The price targets highlight a consensus expectation of growth, within a well-defined range.
| Type | Value |
|---|---|
| High | $265 |
| Low | $206 |
| Median | $232.5 |
| Consensus | $230.67 |
Analyst Sentiment
The sentiment from analysts remains overwhelmingly positive, reinforcing a Buy recommendation.
| Recommendation | Count | Visualization |
|---|---|---|
| Strong Buy | 0 | |
| Buy | 37 | |
| Hold | 21 | |
| Sell | 1 | |
| Strong Sell | 0 |
Conclusion
Darden Restaurants, Inc. demonstrates a strong financial standing with a positive B+ rating in fundamental analysis. The company's robust market presence and diverse portfolio contribute to its stability, supported by strong ROE and ROA metrics. Despite some challenges with the Debt to Equity ratio, the overall performance outlook remains favorable. Analyst price targets further support a bullish perspective, with a wide consensus towards Buy recommendations. Investors may find DRI a strong contender for portfolio diversification, given its consistent market performance and potential for future growth.
Smart Data Insight
Master the Perfect Entry & Exit for this Stock
Don't leave your profits to chance. Historically, this stock follows specific seasonal patterns that institutional traders use to maximize returns.
- ✅ Identify the "Golden Buying Window"
- ✅ Avoid high-risk correction cycles
- ✅ Backtested data from the last 20+ years