April 11, 2026 a 11:44 am
DRI: Fibonacci Analysis - Darden Restaurants, Inc.
Darden Restaurants (NYSE: DRI) has shown a notable downtrend over the past few months. Technical analysis revealed a clear descent from higher price levels, indicating bearish sentiment within the market. The company's diverse restaurant portfolio provides steady revenue streams, but recent market conditions have presented challenges affecting its stock performance.
Fibonacci Analysis
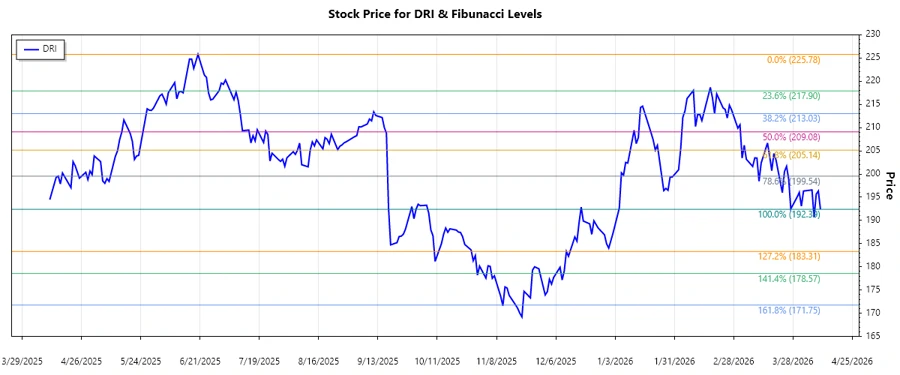
The recent dominant trend for Darden Restaurants, Inc. has been downward, starting from a high of $225.78 on June 20, 2025, and reaching a low of $192.39 on April 10, 2026. Based on this trend, the Fibonacci Retracement levels have been calculated as follows:
| Retracement Level | Price Level |
|---|---|
| 0.236 | $217.92 |
| 0.382 | $211.88 |
| 0.5 | $209.09 |
| 0.618 | $206.30 |
| 0.786 | $201.71 |
Current analysis indicates the stock is trading close to the 0.786 Fibonacci retracement level at present. Technicians would typically view this area as a potential support level where the stock may see buying interest.
Conclusion
In summary, Darden Restaurants, Inc. is experiencing a downtrend, with current trading levels suggesting a potential rebound from a key Fibonacci retracement support. While the strong branding of its varied restaurant lines provides resilience, the broader market's bearish trends represent ongoing risks. Analysts should watch for signals of trend reversal or further declines, particularly around Fibonacci levels, to gauge medium-term investor sentiment.