March 24, 2026 a 10:15 am
DRI: Fibonacci Analysis - Darden Restaurants, Inc.
The stock of Darden Restaurants, Inc. shows a distinct downtrend in recent months, indicating pressure on its market performance. The combination of market sentiment and operational factors might have contributed to this. Investors should consider awaiting a confirmed reversal signal before entering new positions. Technical indicators suggest potential turning points that require careful attention as the market evolves.
Fibonacci Analysis
| Detail | Value |
|---|---|
| Trend Start Date | 2025-07-03 |
| Trend End Date | 2026-03-23 |
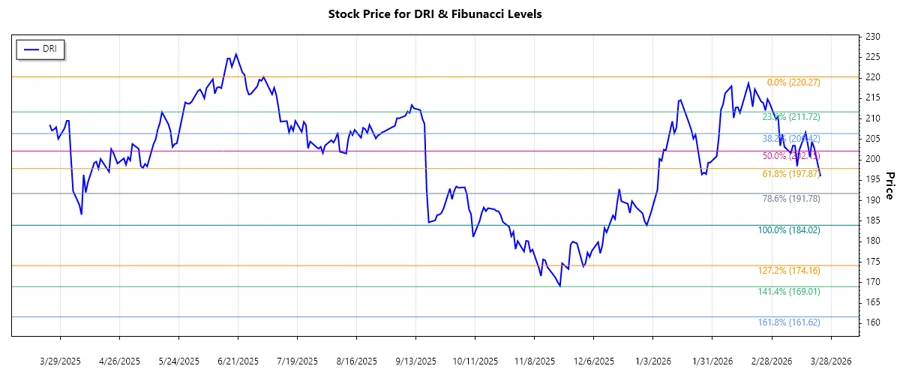
| High Price (Date) | $220.27 (2025-07-03) |
| Low Price (Date) | $184.02 (2025-12-31) |
Fibonacci Retracement Levels
| Level | Price |
|---|---|
| 0.236 | $191.99 |
| 0.382 | $198.30 |
| 0.5 | $202.14 |
| 0.618 | $205.99 |
| 0.786 | $212.29 |
Currently, the stock price is at $195.97, which is within the 0.236-0.382 retracement zone, indicating potential support or resistance at these levels as the market attempts to find equilibrium.
The Fibonacci retracement levels might serve as crucial indicators of support, signaling potential areas where the price could pause or reverse. Investors should watch for confirmation around these levels before making significant decisions.
Conclusion
The recent downtrend in Darden Restaurants, Inc.'s stock price underscores the pressures facing the company's market position. The identified retracement levels could be pivotal as potential support zones, providing opportunities for strategic entry or exit points. While the downtrend suggests caution, the technical signals at these Fibonacci levels highlight possible stabilization areas. Nonetheless, prevailing market dynamics and company-specific factors remain crucial considerations for investors. The current analysis advises vigilance in monitoring market conditions to lever potential opportunities optimally.