January 30, 2026 a 04:44 pm
DRI: Fibonacci Analysis - Darden Restaurants, Inc.
Darden Restaurants, Inc. (DRI) has shown resilience in the food service industry, operating a large network of full-service restaurants across the United States and Canada. As of recent data, the stock has displayed a noteworthy downtrend, providing a context for technical traders to see potential Fibonacci retracement levels. Investors should watch for potential support levels as well as any reversal in the trend, which could signify new opportunities.
Fibonacci Analysis
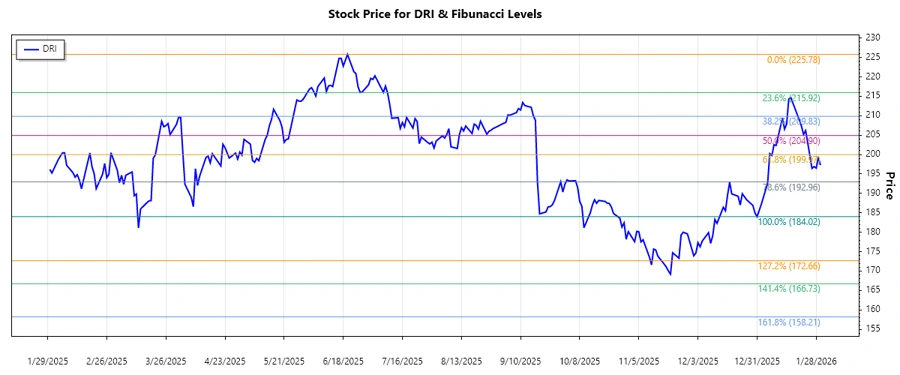
Detailed technical assessment using Fibonacci retracement levels based on the identified downtrend:
| Metric | Value |
|---|---|
| Analyzed Trend Period | 2025-06-20 to 2026-01-30 |
| High Point (Price and Date) | $225.78 on 2025-06-20 |
| Low Point (Price and Date) | $184.02 on 2025-12-31 |
| Fibonacci Level | Price Level |
|---|---|
| 23.6% Retracement | $194.47 |
| 38.2% Retracement | $200.60 |
| 50% Retracement | $204.90 |
| 61.8% Retracement | $209.21 |
| 78.6% Retracement | $214.60 |
The current price of $197.27 is within the 23.6% to 38.2% retracement zone, suggesting a potential support area. A break below this zone could imply further downside risk, while a bounce may indicate a recovery.
Conclusion
The downtrend observed in Darden Restaurants' stock suggests a period of adjustment. The Fibonacci levels indicate potential support areas, where traders might expect a bounce if the stock can hold over the 23.6% level. If breached, the subsequent levels serve as checkpoints for further analysis. Analysts may interpret these retracement zones as crucial indicators for future price movements, with the stock possibly finding stability or continuing its downward trajectory. Investors should remain attentive to broader market cues and sector performance that may impact the stock’s fluctuation.