August 07, 2025 a 05:15 am

DRI: Fibunacci Analysis - Darden Restaurants, Inc.
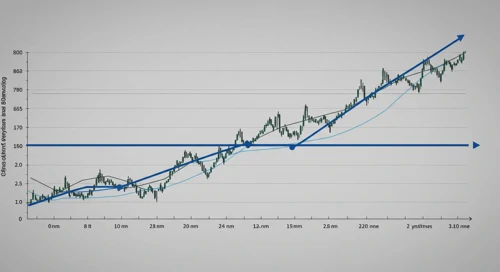
Darden Restaurants, Inc., a leader in full-service dining, has shown a recent dominant downtrend in its stock prices. As the company continues to operate a variety of established restaurant brands, it faces the challenges of changing consumer preferences and economic fluctuations. The current technical analysis provides insights into possible support and resistance levels for traders, considering the recent market behavior.
Fibonacci Analysis
| Parameter | Details |
|---|---|
| Trend Duration | From 2024-08-15 to 2025-08-06 |
| High Point | $225.78 on 2025-06-20 |
| Low Point | $140.82 on 2024-08-14 |
| Fibonacci Levels |
0.236: $160.72 0.382: $178.76 0.5: $194.54 0.618: $210.32 0.786: $225.11 |
| Current Price | $205.15 |
| Retracement Zone | 0.618 |
| Technical Interpretation | The current price of $205.15 indicates the stock is in a 0.618 Fibonacci retracement, suggesting a potential resistance level. |
Conclusion
In conclusion, Darden Restaurants' stock demonstrates a recovery within a sustained downtrend, having reached the 0.618 Fibonacci retracement level. This level can serve as a potential resistance area, making it crucial for potential investors to keep an eye on price movements around this point. Stability at this level could indicate consolidation, while a breakthrough might suggest further upward momentum. The recent fluctuation in prices underscores the inherent risks associated with market volatility, especially given the diverse operational challenges faced by the restaurant industry. For traders, these insights highlight important technical considerations in crafting investment strategies.