April 11, 2026 a 07:30 am


DRI: Dividend Analysis - Darden Restaurants, Inc.
Darden Restaurants, Inc., a prominent entity within the consumer services sector, showcases a robust dividend profile accentuated by a 32-year history of consistent payments. With a dividend yield of 3.12% and sustained growth, Darden positions itself as a reliable income-generating asset. Investors should consider potential macroeconomic impacts on the dining industry's income streams.
📊 Overview
Darden Restaurants stands as a notable player in the hospitality market, underlined by its consistent dividend policy. The stable dividend yield of 3.12% per annum aligns with its historical commitment to shareholders.
| Factor | Details |
|---|---|
| Sector | Consumer Services |
| Dividend yield | 3.12% |
| Current dividend per share | 5.60 USD |
| Dividend history | 32 years |
| Last cut or suspension | None |
🗣️ Dividend History
Analyzing Darden's dividend history reveals its steadfast commitment to returning value to shareholders. This consistency is an assurance to investors of long-term gains.
| Year | Dividend per Share (USD) |
|---|---|
| 2026 | 3.00 |
| 2025 | 5.80 |
| 2024 | 5.42 |
| 2023 | 5.04 |
| 2022 | 4.62 |
📈 Dividend Growth
The growth in Darden's dividends reflects the company’s prudent growth strategies and profitability. Consistent increases in payouts bolster investor confidence in its future trajectory.
| Time | Growth |
|---|---|
| 3 years | 7.88% |
| 5 years | 37.50% |
The average dividend growth is 37.50% over 5 years. This shows moderate but steady dividend growth.
✅ Payout Ratio
A prudent evaluation of payout ratios indicates Darden’s capability to sustain dividends without jeopardizing its financial wellness. The EPS-based ratio provides insights into profit allocations.
| Key figure | Ratio |
|---|---|
| EPS-based | 58.75% |
| Free cash flow-based | 41.22% |
The EPS ratio at 58.75% indicates a well-balanced dividend policy, while the 41.22% FCF ratio confirms operational efficacy in covering dividends.
💸 Cashflow & Capital Efficiency
Cash flow analysis is crucial for understanding Darden's financial health. Efficiency metrics, like the FCF yield and CAPEX metrics, shed light on operational efficiency and capital management.
| Year | 2025 | 2024 | 2023 |
|---|---|---|---|
| Free Cash Flow Yield | 4.32% | 5.56% | 4.93% |
| Earnings Yield | 4.38% | 5.81% | 5.08% |
| CAPEX to Operating Cash Flow | 39.36% | 38.98% | 38.42% |
| Stock-based Compensation to Revenue | 0.65% | 0.60% | 0.64% |
| Free Cash Flow / Operating Cash Flow Ratio | 60.64% | 61.02% | 61.58% |
The data highlights a solid operating strategy and efficiency. A robust FCF yield, combined with a reasonable CAPEX, signals sound capital management.
⚖️ Balance Sheet & Leverage Analysis
A robust balance sheet underpins a company’s long-term viability. Analyzing leverage ratios indicates Darden's financial stability and tolerance for economic downturns.
| Metric | 2025 | 2024 | 2023 |
|---|---|---|---|
| Debt-to-Equity | 2.70 | 2.42 | 2.18 |
| Debt-to-Assets | 49.49% | 47.94% | 46.81% |
| Debt-to-Capital | 72.94% | 70.76% | 68.53% |
| Net Debt to EBITDA | 3.18 | 2.94 | 2.77 |
| Current Ratio | 0.42 | 0.38 | 0.51 |
| Quick Ratio | 0.28 | 0.24 | 0.37 |
| Financial Leverage | 5.45 | 5.05 | 4.65 |
Darden’s leverage step-down and improved liquidity suggest maintaining financial flexibility while capitalizing on growth opportunities.
🏦 Fundamental Strength & Profitability
Profitability metrics like Return on Equity (ROE) and Return on Assets (ROA) reflect Darden’s capacity to generate returns above operational costs, sustaining shareholder wealth.
| Year | 2025 | 2024 | 2023 |
|---|---|---|---|
| Return on Equity | 45.41% | 45.82% | 44.60% |
| Return on Assets | 8.34% | 9.08% | 9.59% |
| Margins: Net | 8.69% | 9.02% | 9.36% |
| Margins: EBIT | 11.31% | 11.58% | 11.53% |
| Margins: EBITDA | 15.58% | 15.62% | 15.23% |
| Margins: Gross | 21.88% | 21.37% | 20.11% |
| Research & Development to Revenue | 0% | 0% | 0% |
Solid profitability margins evidence Darden’s efficient cost management and value-adding strategies, essential for ongoing competitive positioning.
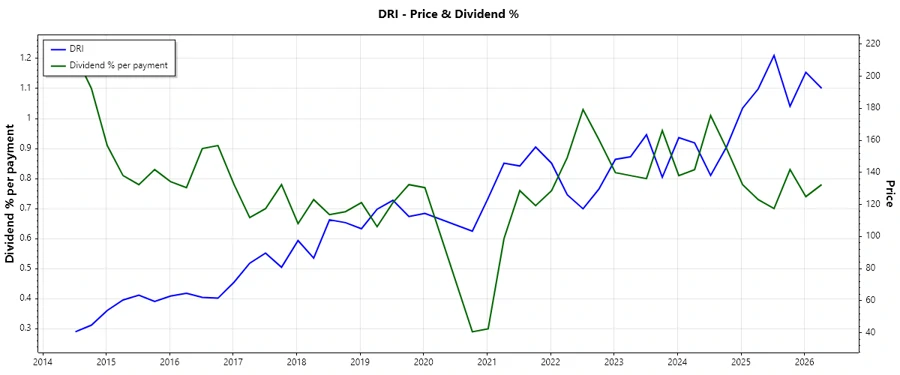
📉 Price Development
📊 Dividend Scoring System
| Category | Score | Score Bar |
|---|---|---|
| Dividend yield | 4 | |
| Dividend Stability | 5 | |
| Dividend growth | 3 | |
| Payout ratio | 4 | |
| Financial stability | 4 | |
| Dividend continuity | 5 | |
| Cashflow Coverage | 4 | |
| Balance Sheet Quality | 3 |
Total Score: 32/40
🎯 Rating
Darden Restaurants, Inc. exemplifies a sturdy dividend stock infused with reliability and growth potential. With competitive yields, historical stability, and prudent financial ratios, it emerges as a favorable option for income-focused investors seeking consistency and assurance amidst market fluctuations.
Smart Data Insight
Master the Perfect Entry & Exit for this Stock
Don't leave your profits to chance. Historically, this stock follows specific seasonal patterns that institutional traders use to maximize returns.
- ✅ Identify the "Golden Buying Window"
- ✅ Avoid high-risk correction cycles
- ✅ Backtested data from the last 20+ years