March 19, 2026 a 07:46 am
DRI: Dividend Analysis - Darden Restaurants, Inc.
Darden Restaurants, Inc. is a prominent player in the dining sector, offering a robust dividend track record with 32 consecutive years of dividend payments. With a market cap of approximately 23 billion USD and a consistent dividend yield of nearly 2.92%, Darden showcases stability in shareholder returns. However, the company's payout ratios and modest dividend growth demand close analysis to ensure sustainable investor value in the long term.
📊 Overview
| Attribute | Value |
|---|---|
| Sector | Dining |
| Dividend yield | 2.92% |
| Current dividend per share | 5.60 USD |
| Dividend history | 32 years |
| Last cut or suspension | None |
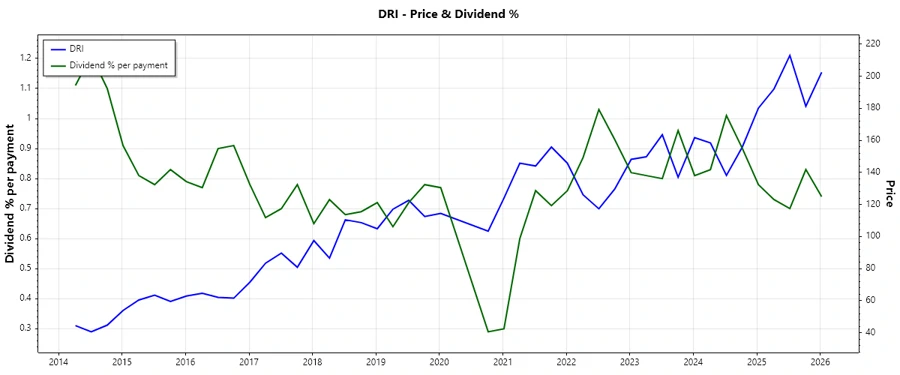
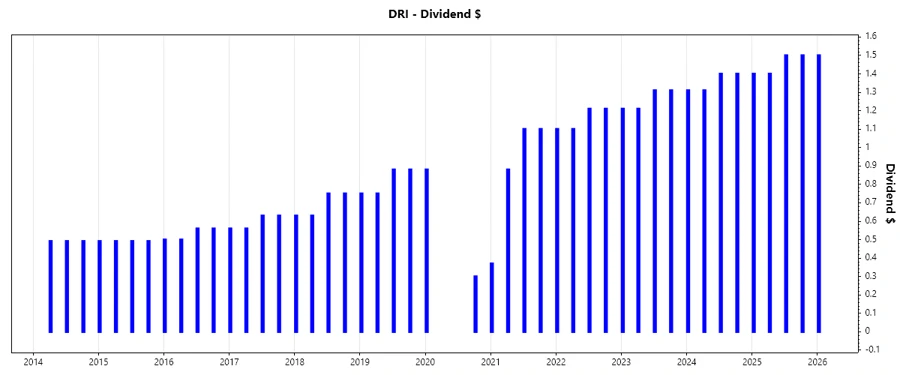
📈 Dividend History
The sustained dividend history of Darden demonstrates its commitment to returning value to shareholders consistently. Understanding this pattern helps investors gauge the company's financial health and management's dedication to shareholder interests.
| Year | Dividend per Share (USD) |
|---|---|
| 2026 | 1.5 |
| 2025 | 5.8 |
| 2024 | 5.42 |
| 2023 | 5.04 |
| 2022 | 4.62 |
📉 Dividend Growth
Monitoring dividend growth provides insights into a company's future earnings potential and its capacity to increase dividends. A steady growth rate indicates strong financial management and sustainability.
| Time | Growth |
|---|---|
| 3 years | 7.88% |
| 5 years | 37.50% |
The average dividend growth is 37.50% over 5 years. This shows moderate but steady dividend growth.
✅ Payout Ratio
Payout ratios are crucial for assessing whether a company can sustain its current dividend levels. Darden's EPS and free cash flow payout ratios suggest a balanced approach to dividend distribution and retention for growth.
| Key figure | Ratio |
|---|---|
| EPS-based | 57.88% |
| Free cash flow-based | 47.96% |
The payout ratio of 57.88% (EPS) and 47.96% (FCF) illustrates a comfortable margin, balancing shareholder rewards and reinvestment potential.
🚀 Cashflow & Capital Efficiency
Cashflow dynamics and capital efficiency are pivotal indicators for understanding financial robustness and operational effectiveness. These metrics offer a window into Darden's ability to generate cash and deploy capital wisely.
| Year | 2025 | 2024 | 2023 |
|---|---|---|---|
| Free Cash Flow Yield | 4.32% | 5.56% | 4.93% |
| Earnings Yield | 4.38% | 5.81% | 5.08% |
| CAPEX to Operating Cash Flow | 39.36% | 38.98% | 38.42% |
| Stock-based Compensation to Revenue | 0.65% | 0.60% | 0.64% |
| Free Cash Flow / Operating Cash Flow Ratio | 60.64% | 61.02% | 61.58% |
A solid Free Cash Flow Yield alongside effective CAPEX management indicates strong fundamental cash stability and efficient capital use.
📊 Balance Sheet & Leverage Analysis
Analyzing the balance sheet and leverage provides insights into financial stability and risk. Darden's leverage ratios and liquidity metrics are key to understanding its capital structure and operational resilience.
| Year | 2025 | 2024 | 2023 |
|---|---|---|---|
| Debt-to-Equity | 2.70 | 2.42 | 2.18 |
| Debt-to-Assets | 49.49% | 47.94% | 46.81% |
| Debt-to-Capital | 72.94% | 70.76% | 68.53% |
| Net Debt to EBITDA | 3.17 | 2.94 | 2.77 |
| Current Ratio | 0.39 | 0.38 | 0.51 |
| Quick Ratio | 0.28 | 0.24 | 0.37 |
| Financial Leverage | 5.45 | 5.05 | 4.65 |
While debt levels are significant, the trends in leverage reduction suggest calculated management of financial obligations.
📈 Fundamental Strength & Profitability
Profitability trends and fundamental strength emphasize Darden's efficiency and scalability in market operations. Monitoring these parameters informs investors about future earnings potential and profitability stability.
| Year | 2025 | 2024 | 2023 |
|---|---|---|---|
| Return on Equity | 45.41% | 45.82% | 44.60% |
| Return on Assets | 8.34% | 9.08% | 9.59% |
| Net Margin | 8.69% | 9.02% | 9.36% |
| EBIT Margin | 11.31% | 11.58% | 11.53% |
| EBITDA Margin | 15.58% | 15.62% | 15.23% |
| Gross Margin | 21.88% | 21.37% | 20.11% |
| R&D to Revenue | 0% | 0% | 0% |
Sustained profitability ratios reflect robust operational performance, making Darden a durable player in its sector.
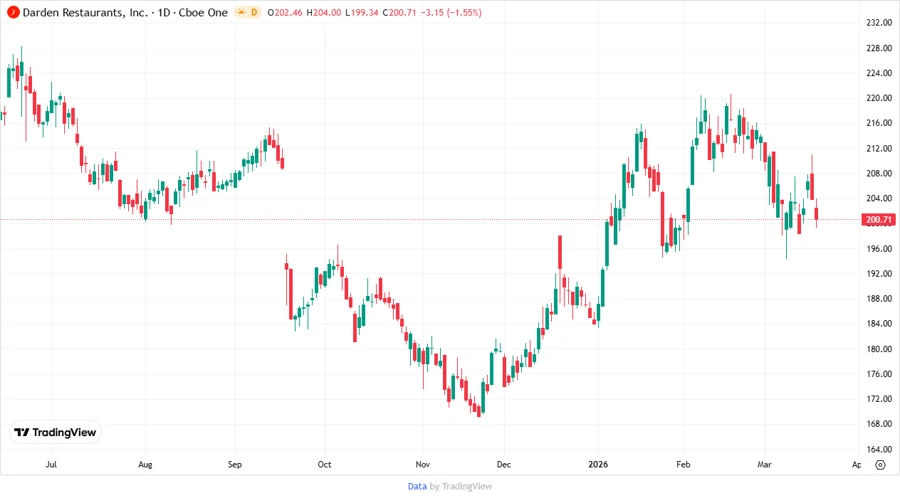
📉 Price Development
🔍 Dividend Scoring System
| Category | Rating | Score |
|---|---|---|
| Dividend yield | 4 | |
| Dividend Stability | 5 | |
| Dividend growth | 3 | |
| Payout ratio | 4 | |
| Financial stability | 3 | |
| Dividend continuity | 5 | |
| Cashflow Coverage | 4 | |
| Balance Sheet Quality | 3 |
Total score: 31/40
🗣️ Rating
Darden Restaurants, Inc. exhibits a strong dividend profile with consistent payouts and a solid five-year growth trajectory. Although financial leverage is notable, the company maintains a prudent payout policy complemented by robust fundamental performance metrics and liquidity management. Darden remains an attractive option for dividend-focused investors looking for reliability and moderate growth potential in the dining sector.
Smart Data Insight
Master the Perfect Entry & Exit for this Stock
Don't leave your profits to chance. Historically, this stock follows specific seasonal patterns that institutional traders use to maximize returns.
- ✅ Identify the "Golden Buying Window"
- ✅ Avoid high-risk correction cycles
- ✅ Backtested data from the last 20+ years