October 23, 2025 a 02:46 am

DRI: Dividend Analysis - Darden Restaurants, Inc.
Darden Restaurants, Inc. demonstrates resilient dividend policies with a consistent payout history of 31 years. The dividend yield stands at 3.20%, making it an attractive choice for income-focused investors. With a strategic growth plan, the company has shown a modest growth rate in dividends over the years.
📊 Overview
Darden Restaurants, in the consumer discretionary sector, showcases strong dividend credentials with a yield of 3.20% and a consistent dividend history for over three decades.
| Metric | Value |
|---|---|
| Sector | Consumer Discretionary |
| Dividend Yield | 3.20% |
| Current Dividend per Share | $5.60 USD |
| Dividend History | 31 years |
| Last Cut or Suspension | 2020 |
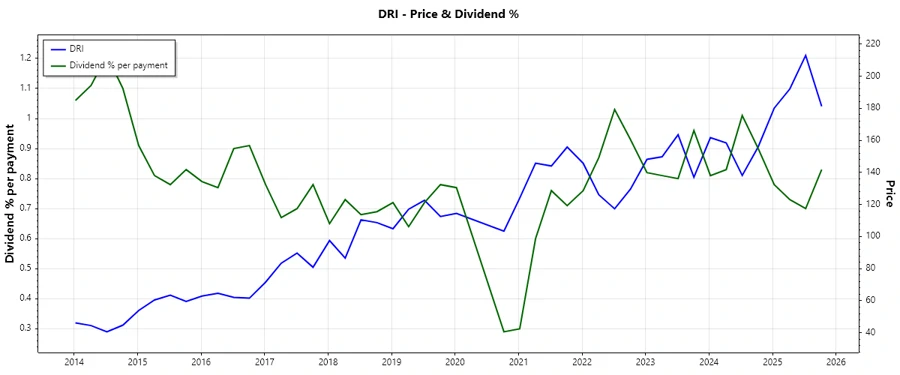
🗣️ Dividend History
With a 31-year history of paying dividends, Darden Restaurants has established itself as a reliable income source for its shareholders, even though a setback occurred in 2020.
| Year | Dividend per Share (USD) |
|---|---|
| 2025 | 5.80 |
| 2024 | 5.42 |
| 2023 | 5.04 |
| 2022 | 4.62 |
| 2021 | 3.45 |
📈 Dividend Growth
Dividend growth is a key metric, showcasing the company's ability to increase shareholder returns over time. Darden has demonstrated steady growth, reflecting its operational stability and robust financial health.
| Time | Growth |
|---|---|
| 3 years | 16.25% |
| 5 years | 10.70% |
The average dividend growth is 10.70% over 5 years. This shows moderate but steady dividend growth.
💹 Payout Ratio
The payout ratio is a critical indicator of dividend sustainability. Darden has managed its payouts efficiently, balancing between earnings and free cash flow coverage.
| Key Figure | Ratio |
|---|---|
| EPS-based | 59.45% |
| Free Cash Flow-based | 52.19% |
An EPS payout ratio of 59.45% and a FCF payout ratio of 52.19% suggest that the dividend is well covered by both earnings and cash flow, indicating strong financial health.
📈 Cashflow & Capital Efficiency
Cash flow and capital efficiency are critical elements for sustainable dividend payments. Darden's financials highlight a solid free cash flow yield and strategic capital allocation.
| Year | 2023 | 2024 | 2025 |
|---|---|---|---|
| Free Cash Flow Yield | 4.84% | 5.56% | 4.32% |
| Earnings Yield | 4.99% | 5.81% | 4.38% |
| CAPEX to Operating Cash Flow | 38.42% | 38.98% | 39.36% |
| Stock Compensation to Revenue | 0.64% | 0.60% | 0.65% |
| Free Cash Flow / Operating Cash Flow Ratio | 61.58% | 61.02% | 60.64% |
Darden's strong free cash flow to operating cash flow ratio illustrates efficient cash management, supporting its dividend strategy.
🗂️ Balance Sheet & Leverage Analysis
Understanding leverage and balance sheet health is crucial for assessing the risk associated with dividend sustainability. Darden maintains sound financial metrics that reassure its ability to manage debt obligations effectively.
| Year | 2023 | 2024 | 2025 |
|---|---|---|---|
| Debt-to-Equity | 2.18 | 2.42 | 2.70 |
| Debt-to-Assets | 46.81% | 47.94% | 49.49% |
| Debt-to-Capital | 68.53% | 70.76% | 72.94% |
| Net Debt to EBITDA | 2.77 | 2.94 | 3.18 |
| Current Ratio | 0.51 | 0.38 | 0.42 |
| Quick Ratio | 0.37 | 0.24 | 0.28 |
| Financial Leverage | 4.65 | 5.05 | 5.45 |
Darden's leverage ratios reflect a balanced approach to debt management, maintaining healthy financial leverage and liquidity ratios.
🧮 Fundamental Strength & Profitability
Profitability metrics portray the company's ability to generate returns efficiently. These ratios are pivotal for assessing intrinsic value and long-term growth potential.
| Year | 2023 | 2024 | 2025 |
|---|---|---|---|
| Return on Equity | 44.60% | 45.82% | 45.41% |
| Return on Assets | 9.59% | 9.08% | 8.34% |
| Return on Invested Capital | 12.41% | 12.15% | 11.40% |
| Net Margin | 9.36% | 9.02% | 8.69% |
| EBIT Margin | 11.53% | 11.58% | 11.31% |
| EBITDA Margin | 15.23% | 15.62% | 15.58% |
| Gross Margin | 20.11% | 21.37% | 21.88% |
| R&D to Revenue | 0.00% | 0.00% | 0.00% |
The high return on equity and stable margins indicate efficient operations and a strong market position.
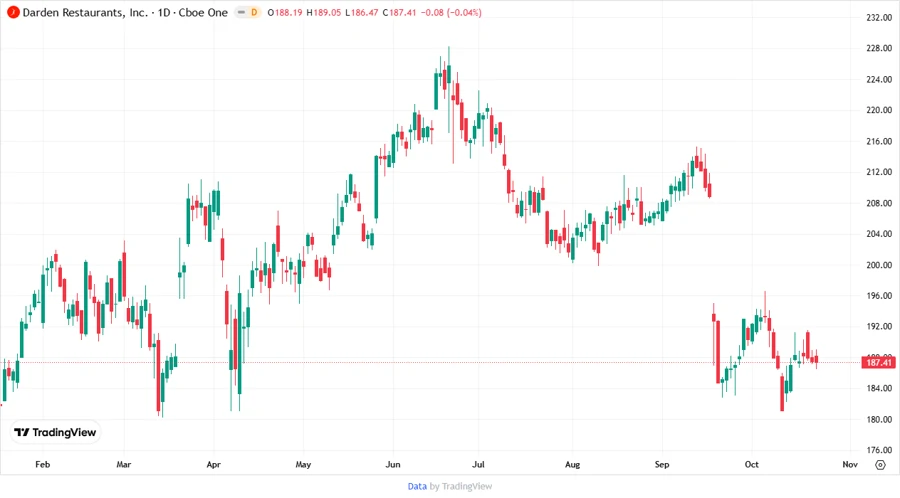
📉 Price Development
✅ Dividend Scoring System
| Category | Score | |
|---|---|---|
| Dividend Yield | 4 | |
| Dividend Stability | 5 | |
| Dividend Growth | 3 | |
| Payout Ratio | 4 | |
| Financial Stability | 4 | |
| Dividend Continuity | 5 | |
| Cashflow Coverage | 4 | |
| Balance Sheet Quality | 4 |
Total Score: 33/40
🛡️ Rating
Darden Restaurants, Inc. presents a compelling case for dividend investors with its reliable dividend track record, strategic growth trajectory, and robust financial metrics. It is recommended as a strong candidate for income-focused portfolios, balancing both yield and growth prospects.