August 15, 2025 a 04:45 pm
DPZ: Fibonacci Analysis - Domino's Pizza, Inc.
Domino's Pizza, Inc., has shown significant volatility in recent months amidst a constantly evolving market. Known for its vast network of stores and diverse product offering, the stock has reacted to both macroeconomic pressures and internal corporate strategies. Recent price movements suggest potential turning points that might offer trading opportunities. Amid the current market, technical analysis provides insights into future movements, making it important to evaluate key levels. This analysis focuses on Fibonacci retracement levels to gauge support and resistance areas.
Fibonacci Analysis
| Information | Details |
|---|---|
| Trend Start Date | 2025-05-19 |
| Trend End Date | 2025-08-13 |
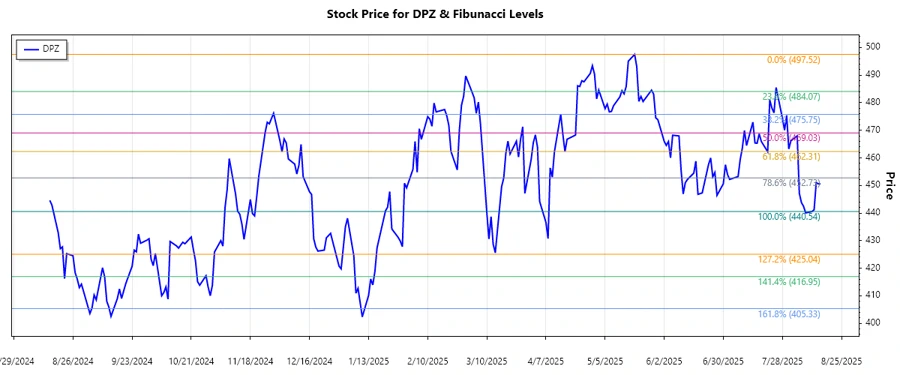
| High Point | $497.52 on 2025-05-19 |
| Low Point | $440.54 on 2025-08-11 |
| Fibonacci Level | Price |
|---|---|
| 0.236 | $455.34 |
| 0.382 | $466.81 |
| 0.5 | $473.17 |
| 0.618 | $479.52 |
| 0.786 | $488.45 |
The current price of $450.51 is within the 0.236 retracement level. This suggests a potential support area, and any upward movement might encounter resistance around the higher Fibonacci levels.
Conclusion
Domino's Pizza, Inc. has experienced a downward trend over the past few months, indicative of potential concerns regarding its market position or broader economic factors. The stock is currently trading around a key Fibonacci retracement level which could act as support. However, breaking below this level might lead to further declines. Investors should monitor volumes and momentum indicators to anticipate any reversals. While Fibonacci levels provide insights into potential trading zones, they should be used in conjunction with other technical indicators to make informed decisions. Analyst sentiment remains cautious with a focus on consumer behavior and international expansion.
Smart Data Insight
Master the Perfect Entry & Exit for this Stock
Don't leave your profits to chance. Historically, this stock follows specific seasonal patterns that institutional traders use to maximize returns.
- ✅ Identify the "Golden Buying Window"
- ✅ Avoid high-risk correction cycles
- ✅ Backtested data from the last 20+ years