
February 28, 2026 a 03:30 pm
DPZ: Dividend Analysis - Domino's Pizza, Inc.
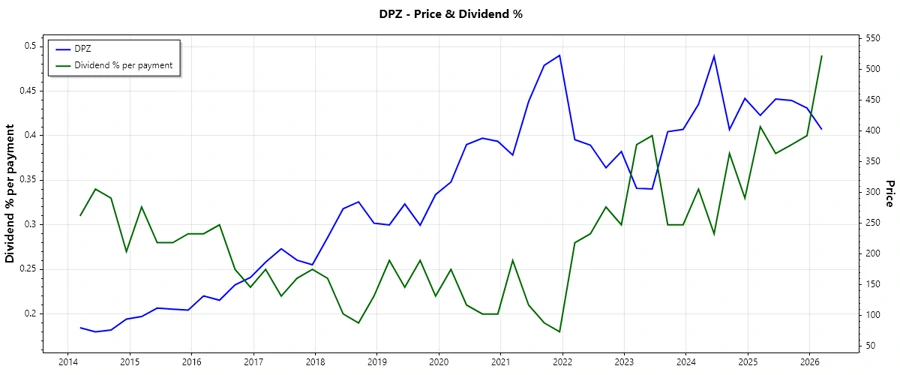
Domino's Pizza, Inc. offers a modest yet stable dividend profile suitable for conservative dividend investors. With a dividend yield of 1.79% and a dividend history spanning 19 years, this company demonstrates consistency in delivering shareholder returns. However, negative return on equity and high debt ratios might raise concerns for some investors about financial health.
Overview
📊 The key dividend metrics for Domino's Pizza, Inc. underline a stable history of payouts, evidenced by a 19-year streak of dividend distributions. Although the dividend yield remains modest, it's the consistency that sets it apart.| Metric | Value |
|---|---|
| Sector | Consumer Cyclical |
| Dividend Yield | 1.79% |
| Current Dividend per Share | $6.97 |
| Dividend History | 19 years |
| Last Cut or Suspension | None |
Dividend History
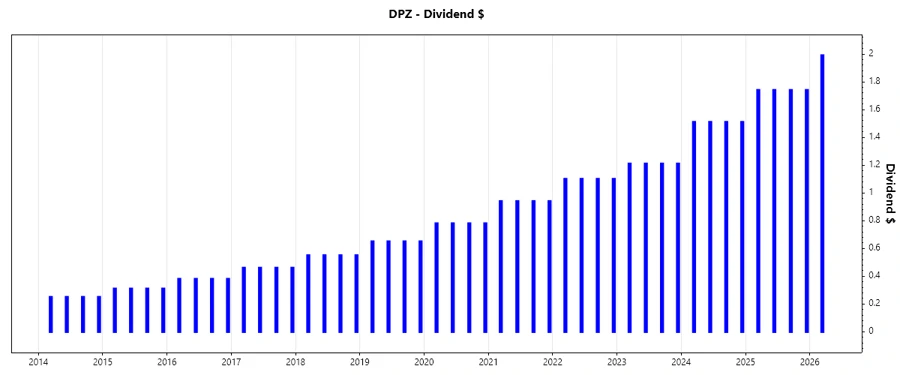
🗣️ Historical dividend payments highlight the longevity of dividend deliverance by the company. This record ensures investor confidence in continuous income.
| Year | Dividend per Share |
|---|---|
| 2026 | $1.99 |
| 2025 | $6.96 |
| 2024 | $6.04 |
| 2023 | $4.84 |
| 2022 | $4.40 |
Dividend Growth
📈 Dividend growth rates provide insight into potential future income escalation. Over the past 5 years, Domino's has shown growth, hinting at increasing payouts for the future.| Time | Growth |
|---|---|
| 3 years | 16.52% |
| 5 years | 17.41% |
The average dividend growth is 17.41% over 5 years. This shows moderate but steady dividend growth.
Payout Ratio
📉 Evaluating payout ratios uncovers the dividend sustainability of a company. With 39.37% based on EPS and 34.88% based on free cash flow, Domino's exhibits a sustainable dividend strategy.| Key Figure | Ratio |
|---|---|
| EPS-based | 39.37% |
| Free cash flow-based | 34.88% |
The payout ratio indicates the company is using a conservative approach to maintain its dividend payments, providing assurance to investors about its dividend sustainability.
Cashflow & Capital Efficiency
✅ Critical analysis of cash flow and capital allocation reveals how effectively the company manages its resources and its ability to maintain dividends.| Metric | 2025 | 2024 | 2023 |
|---|---|---|---|
| Free Cash Flow Yield | 4.69% | 3.50% | 3.36% |
| Earnings Yield | 4.20% | 4.00% | 3.59% |
| CAPEX to Operating Cash Flow | 15.22% | 18.06% | 17.84% |
| Stock-based Compensation to Revenue | 0.90% | 0.92% | 0.84% |
| Free Cash Flow / Operating Cash Flow Ratio | 84.78% | 81.94% | 82.16% |
The data suggests Domino's uses its capital efficiently, maintaining robust cash flow to support ongoing dividend disbursements.
Balance Sheet & Leverage Analysis
⚠️ Thorough leverage and balance sheet analysis indicate the financial health and debt management of the enterprise, impacting dividend payments.| Metric | 2025 | 2024 | 2023 |
|---|---|---|---|
| Debt-to-Equity | -1.34 | -1.31 | -1.28 |
| Debt-to-Assets | 2.90 | 2.99 | 3.11 |
| Net Debt to EBITDA | 4.53 | 4.98 | 5.48 |
| Current Ratio | 1.65 | 0.56 | 1.49 |
| Quick Ratio | 1.50 | 0.52 | 1.34 |
While the company showcases an adequate liquidity position, the aggressive leverage ratios may pose risks and necessitate careful future financial management.
Fundamental Strength & Profitability
🔍 Assessment of fundamental strengths and profitability ratios determines the company's viability and efficiency.| Metric | 2025 | 2024 | 2023 |
|---|---|---|---|
| Return on Equity | -15.42% | -14.74% | -12.75% |
| Return on Assets | 33.40% | 33.63% | 30.99% |
| Net Margin | 12.18% | 12.41% | 11.59% |
| EBITDA Margin | 21.46% | 21.37% | 20.75% |
| R&D to Revenue | 0% | 0% | 0% |
Despite innovative inefficiency, profitability remains robust, delivering strong returns on core asset bases.
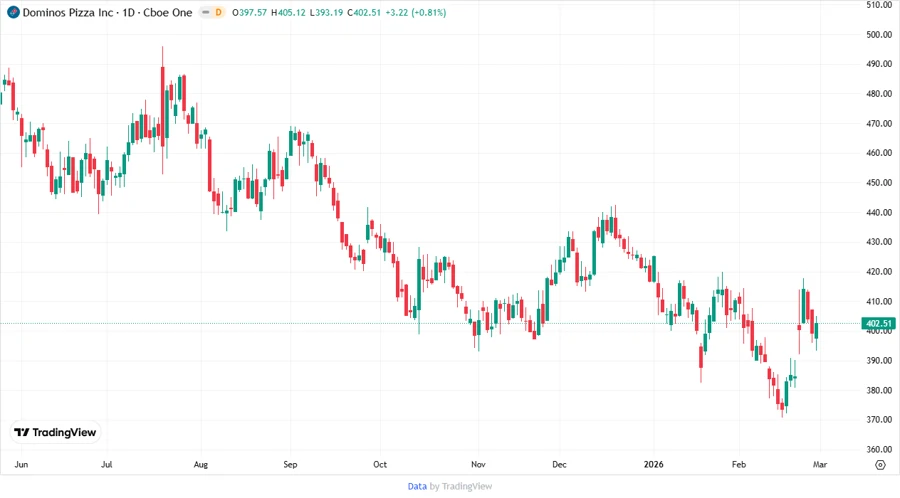
Price Development
Dividend Scoring System
| Category | Score |
|---|---|
| Dividend Yield | 3 |
| Dividend Stability | 4 |
| Dividend Growth | 4 |
| Payout Ratio | 5 |
| Financial Stability | 3 |
| Dividend Continuity | 5 |
| Cashflow Coverage | 4 |
| Balance Sheet Quality | 2 |
Total Score: 30/40
Rating
Domino's Pizza, Inc. maintains a steady dividend profile ensuring ongoing shareholder rewards. While the company's fundamental ratios indicate some areas of concern, especially with leverage, its historical dividend reliability and modest growth potential make it a viable, though cautious, selection for dividend-savvy investors.
Smart Data Insight
Master the Perfect Entry & Exit for this Stock
Don't leave your profits to chance. Historically, this stock follows specific seasonal patterns that institutional traders use to maximize returns.
- ✅ Identify the "Golden Buying Window"
- ✅ Avoid high-risk correction cycles
- ✅ Backtested data from the last 20+ years