August 24, 2025 a 07:31 am
DPZ: Dividend Analysis - Domino's Pizza, Inc.
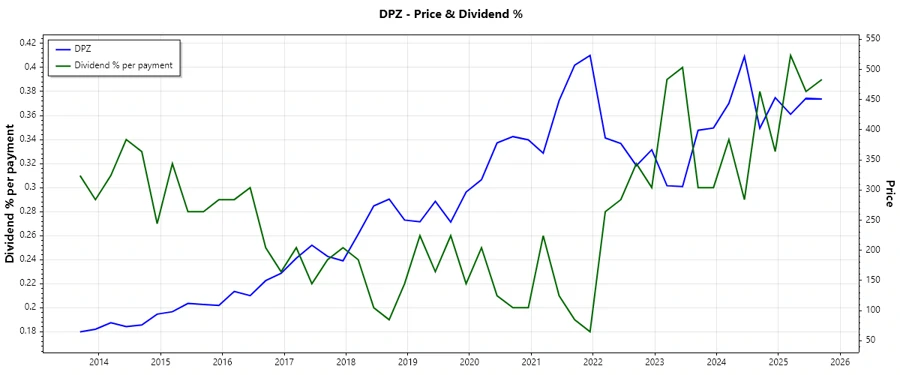
Domino's Pizza has built a solid reputation in the quick-service restaurant sector, standing out with consistent dividend payments over the years. With its current dividend yield at 1.49%, the company offers a stable return for income-focused investors. However, the exploration of its financials reveals nuances in growth dynamics and payout sustainability.
📊 Overview
Domino's Pizza operates in the Consumer Discretionary sector, delivering significant value through years of consistent dividends and growth. The data highlights a resilient dividend history, driven by strong fundamentals.
| Metric | Value |
|---|---|
| Sector | Consumer Discretionary |
| Dividend yield | 1.49% |
| Current dividend per share | 6.05 USD |
| Dividend history | 18 years |
| Last cut or suspension | None |
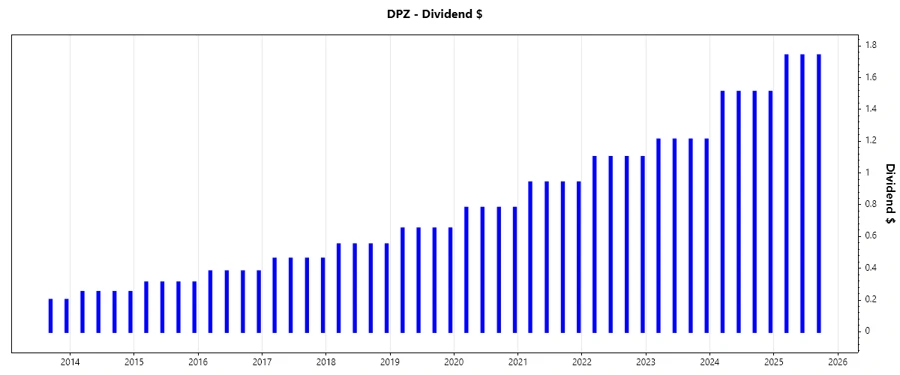
🗣️ Dividend History
Domino's Pizza has maintained an impressive 18-year streak of uninterrupted dividends, which underscores its reliability and commitment to returning value to shareholders. This history is a testament to the company's robust earnings power and careful financial management.
| Year | Dividend per Share (USD) |
|---|---|
| 2025 | 5.22 |
| 2024 | 6.04 |
| 2023 | 4.84 |
| 2022 | 4.40 |
| 2021 | 3.76 |
📈 Dividend Growth
Examining the company's recent dividend growth offers valuable insights into its financial health and commitment to shareholders. The growth rates over the past 3 and 5 years highlight a steady and promising trend.
| Time | Growth |
|---|---|
| 3 years | 17.12% |
| 5 years | 18.36% |
The average dividend growth is 18.36% over 5 years. This shows moderate but steady dividend growth.
✅ Payout Ratio
Payout ratios provide key insights into how much profit is being returned to shareholders versus reinvestment in business operations. A balanced payout rate is crucial for healthy financial management.
| Payout Ratio | Value |
|---|---|
| EPS-based | 34.59% |
| Free cash flow-based | 35.81% |
The EPS-based payout ratio of 34.59% and FCF-based payout ratio of 35.81% indicate a well-managed dividend policy with sufficient company profits being reinvested back into the business for growth.
📊 Cashflow & Capital Efficiency
Assessing cash flow dynamics is essential in understanding a firm's ability to generate sufficient cash to cover operations, fund growth, and continue dividend payments. These indicators offer a snapshot of financial health and resource management.
| Year | 2024 | 2023 | 2022 |
|---|---|---|---|
| Free Cash Flow Yield | 3.50% | 3.36% | 3.13% |
| Earnings Yield | 4.00% | 3.59% | 3.65% |
| CAPEX to Operating Cash Flow | 15.79% | 17.84% | 18.35% |
| Stock-based Compensation to Revenue | 0.88% | 0.84% | 0.63% |
| Free Cash Flow / Operating Cash Flow Ratio | 81.94% | 82.16% | 81.65% |
The historical trend in free cash flow yield and earnings yield suggests a stable cash flow generation capability, crucial for sustaining corporate initiatives and regular dividends.
🏦 Balance Sheet & Leverage Analysis
Evaluating a company's leverage and balance sheet health highlight its ability to meet long-term obligations. The company's leverage ratios suggest aspects about its financial stability and potential risks associated with borrowing.
| Year | 2024 | 2023 | 2022 |
|---|---|---|---|
| Debt-to-Equity | -1.31 | -1.28 | -1.25 |
| Debt-to-Assets | 2.99 | 3.11 | 3.28 |
| Debt-to-Capital | 4.21 | 4.57 | 4.94 |
| Net Debt to EBITDA | 4.98 | 5.48 | 6.10 |
| Current Ratio | 0.60 | 1.49 | 1.47 |
| Quick Ratio | 0.52 | 1.34 | 1.32 |
| Financial Leverage | -0.44 | -0.41 | -0.38 |
The current ratios and leverage figures imply an adequate management of the balance sheet, although moving towards a cautious evolution to ensure buffer against market volatility.
📈 Fundamental Strength & Profitability
Intrinsic metrics like ROE, ROA, and profit margins provide insight into profitability and efficiency. These indicators reflect how effectively the company balances opportunity with resource deployment.
| Year | 2024 | 2023 | 2022 |
|---|---|---|---|
| Return on Equity | -14.74% | -12.75% | -10.80% |
| Return on Assets | 33.63% | 30.99% | 28.23% |
| Margins: Net | 12.41% | 11.59% | 9.97% |
| Margins: EBIT | 19.51% | 18.95% | 16.99% |
| Margins: EBITDA | 21.37% | 20.75% | 18.76% |
| Margins: Gross | 39.28% | 38.56% | 36.34% |
| Research & Development to Revenue | 0 | 0 | 0 |
The company's lower ROE juxtaposed with robust asset returns indicates operational efficiency, albeit with a caveat on shareholder equity utilization.
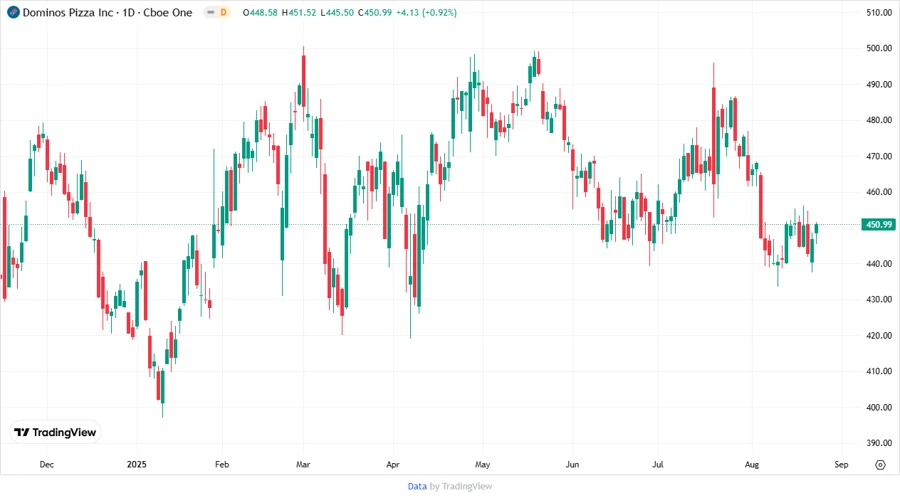
📉 Price Development
✅ Dividend Scoring System
The scoring system evaluates various inputs essential for assessing the dividend's attractiveness. This composite index provides a holistic view to inform investment decisions.
| Criteria | Score (1-5) | Score Bar |
|---|---|---|
| Dividend yield | 2 | |
| Dividend Stability | 4 | |
| Dividend growth | 4 | |
| Payout ratio | 5 | |
| Financial stability | 3 | |
| Dividend continuity | 5 | |
| Cashflow Coverage | 3 | |
| Balance Sheet Quality | 2 |
Total Score: 28/40
📈 Rating
Despite a moderate dividend yield, Domino's Pizza showcases strong growth potential and a commendable dividend policy, making it a preferred choice for investors seeking stability and long-term appreciation over immediate high returns. The discretion advised in monitoring financial leverage indicates prudent behavior amid market shifts.
Smart Data Insight
Master the Perfect Entry & Exit for this Stock
Don't leave your profits to chance. Historically, this stock follows specific seasonal patterns that institutional traders use to maximize returns.
- ✅ Identify the "Golden Buying Window"
- ✅ Avoid high-risk correction cycles
- ✅ Backtested data from the last 20+ years