July 04, 2025 a 07:31 am
DPZ: Dividend Analysis - Domino's Pizza, Inc.
Domino's Pizza, Inc. stands out with its strategic dividend policy that supports consistent returns. Despite market volatility, the company upholds a steady dividend yield driven by robust cash flows. As a potential dividend stock, Domino's continues to appeal to long-term income-focused investors, marking its significance in the fast-food and quick service dining sector.
📊 Overview
Analyzing Domino's Pizza's dividend profile reveals its strategic approach to long-term shareholder value. Key figures below illustrate its stability and growth potential in dividend payments.
| Metric | Value |
|---|---|
| Sector | Consumer Discretionary - Restaurants |
| Dividend yield | 1.44 % |
| Current dividend per share | 6.05 USD |
| Dividend history | 18 years |
| Last cut or suspension | None |
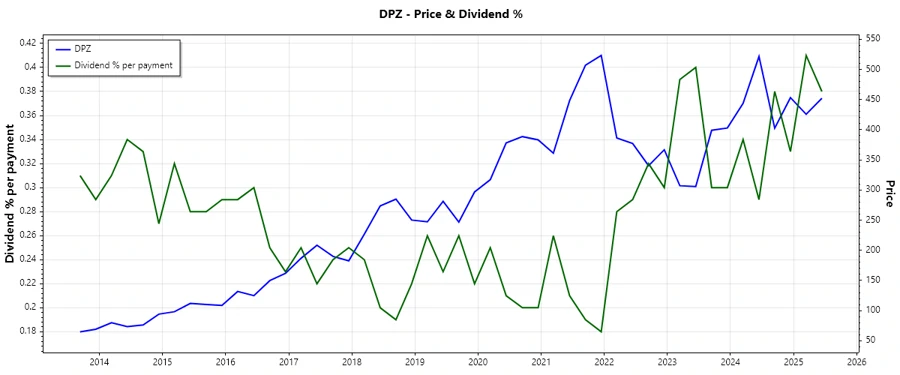
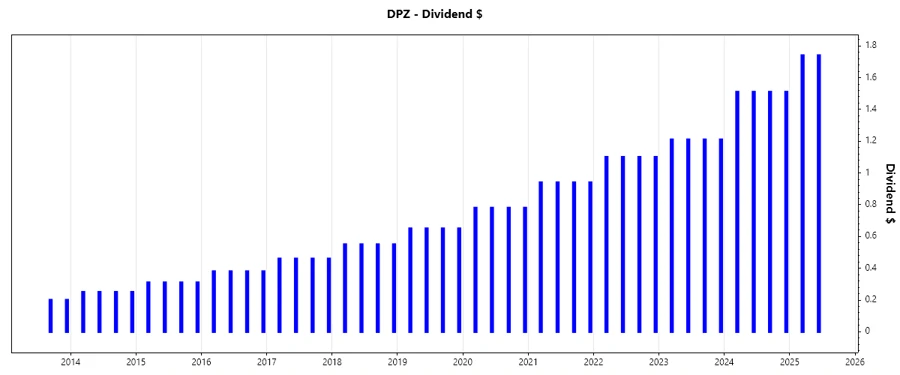
📈 Dividend History
Understanding the history of dividend payments is crucial to assessing the reliability and commitment of a company towards shareholder returns. Domino's Pizza demonstrates a resilient trend in dividend history.
| Year | Dividend per Share (USD) |
|---|---|
| 2025 | 3.48 |
| 2024 | 6.04 |
| 2023 | 4.84 |
| 2022 | 4.40 |
| 2021 | 3.76 |
🚀 Dividend Growth
Dividend growth is a testament to the financial health and confidence of a company in its future earnings visibility. Domino's Pizza exhibits consistent growth, providing investors with the promise of rising income streams.
| Time | Growth |
|---|---|
| 3 years | 17.12 % |
| 5 years | 18.36 % |
The average dividend growth is 18.36 % over 5 years. This shows moderate but steady dividend growth.
💰 Payout Ratio
Payout ratios are essential for evaluating how sustainable a company's dividend payments are. Lower ratios suggest more room for increased payouts or reinvestment into the business.
| Key figure | Ratio |
|---|---|
| EPS-based | 34.46 % |
| Free cash flow-based | 36.12 % |
With a 34.46 % EPS-based payout ratio and a 36.12 % FCF-based payout ratio, Domino's displays a healthy capacity for maintaining and potentially growing its dividend.
🔍 Cashflow & Capital Efficiency
Reviewing cash flow metrics provides insights into the operational efficiency and the ability to sustain dividend payments from internal cash generation.
| Year | 2022 | 2023 | 2024 |
|---|---|---|---|
| Free Cash Flow Yield | 3.14 % | 3.36 % | 3.50 % |
| Earnings Yield | 3.65 % | 3.59 % | 4.00 % |
| CAPEX to Operating Cash Flow | 18.35 % | 17.84 % | 18.06 % |
| Stock-based Compensation to Revenue | 0.63 % | 0.84 % | 0.92 % |
| Free Cash Flow / Operating Cash Flow Ratio | 81.65 % | 82.16 % | 81.94 % |
The robust cash flow figures coupled with efficient capital usage suggest a solid foundation for future dividend payments.
⚖️ Balance Sheet & Leverage Analysis
Balance sheet strength and leverage ratios are indicative of a company's financial resilience and ability to meet long-term obligations while maintaining growth potential.
| Year | 2022 | 2023 | 2024 |
|---|---|---|---|
| Debt-to-Equity | -1.25 | -1.28 | -1.31 |
| Debt-to-Assets | 3.28 | 3.11 | 2.99 |
| Debt-to-Capital | 4.94 | 4.57 | 4.21 |
| Net Debt to EBITDA | 6.10 | 5.48 | 4.98 |
| Current Ratio | 1.47 | 1.49 | 0.56 |
| Quick Ratio | 1.32 | 1.34 | 0.52 |
The unfavorable debt-to-equity and other leverage metrics are concerning but may indicate aggressive growth strategies rather than financial distress.
🏦 Fundamental Strength & Profitability
A comprehensive review of fundamental metrics indicates a company’s operational efficiency and profitability, which support dividend payments and reinvestment strategies.
| Year | 2022 | 2023 | 2024 |
|---|---|---|---|
| Return on Equity | -10.80 % | -12.75 % | -14.74 % |
| Return on Assets | 28.23 % | 30.99 % | 33.63 % |
| Net Margin | 9.97 % | 11.59 % | 12.41 % |
| EBIT Margin | 16.99 % | 18.95 % | 19.51 % |
| EBITDA Margin | 18.76 % | 20.75 % | 21.37 % |
| Gross Margin | 36.34 % | 38.56 % | 39.28 % |
Despite negative ROE, other profitability metrics are strong, suggesting operational excellence and efficient cost management to support dividend payouts.
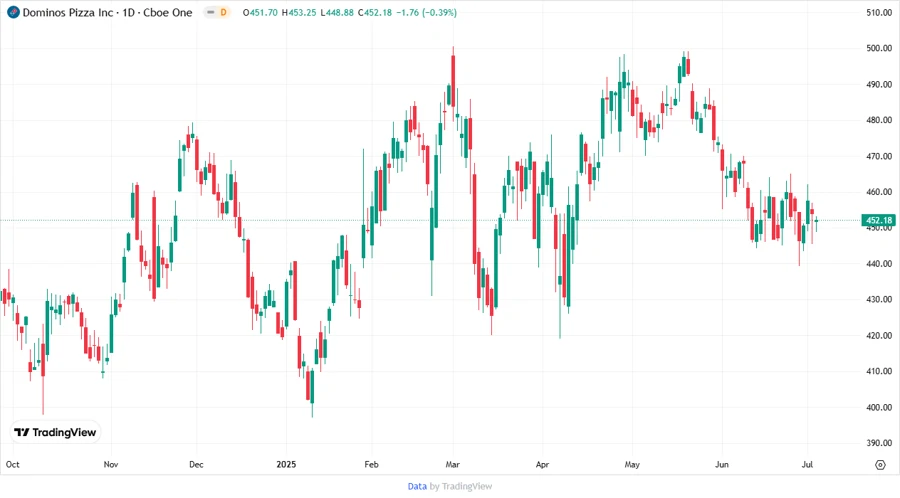
📊 Price Development
🗨️ Dividend Scoring System
Evaluating Domino's Pizza via our dividend scoring system provides insights into its dividend policy effectiveness and financial health.
| Criterion | Score | Score Bar |
|---|---|---|
| Dividend yield | 3 | |
| Dividend Stability | 4 | |
| Dividend growth | 4 | |
| Payout ratio | 4 | |
| Financial stability | 2 | |
| Dividend continuity | 5 | |
| Cashflow Coverage | 4 | |
| Balance Sheet Quality | 2 |
Total Score: 28/40
✅ Rating
Based on the comprehensive analysis, Domino's Pizza demonstrates a solid dividend policy empowered by reliable cash flows and a commitment to continuity. The moderate financial leverage suggests calculated risk-taking to support growth. Long-term dividend investors may find its steady return appealing, yet should weigh leverage risks accordingly.
Smart Data Insight
Master the Perfect Entry & Exit for this Stock
Don't leave your profits to chance. Historically, this stock follows specific seasonal patterns that institutional traders use to maximize returns.
- ✅ Identify the "Golden Buying Window"
- ✅ Avoid high-risk correction cycles
- ✅ Backtested data from the last 20+ years