June 15, 2026 a 03:43 pm
DOV: Fundamental Ratio Analysis - Dover Corporation
Dover Corporation, operating within the Industrials sector, showcases a robust portfolio across numerous segments. The diverse operational scope promises stability and growth potential. As of 2026, their innovative approach in sustainable technologies positions them strategically within the rapidly evolving market landscape.
Fundamental Rating
The fundamental analysis of Dover Corporation reveals balanced scoring metrics, indicating strengths in assets management and modest liabilities handling.
| Category | Score | Visualization |
|---|---|---|
| Overall | 3 | |
| Discounted Cash Flow | 3 | |
| Return on Equity | 4 | |
| Return on Assets | 5 | |
| Debt to Equity | 2 | |
| Price to Earnings | 2 | |
| Price to Book | 2 |
Historical Rating
Historical performance assessments demonstrate consistent strategic management, maintaining stable scores.
| Date | Overall | DCF | ROE | ROA | Debt to Equity | P/E | P/B |
|---|---|---|---|---|---|---|---|
| 2026-06-12 | 3 | 3 | 4 | 5 | 2 | 2 | 2 |
| Earlier Date | 0 | 3 | 4 | 5 | 2 | 2 | 2 |
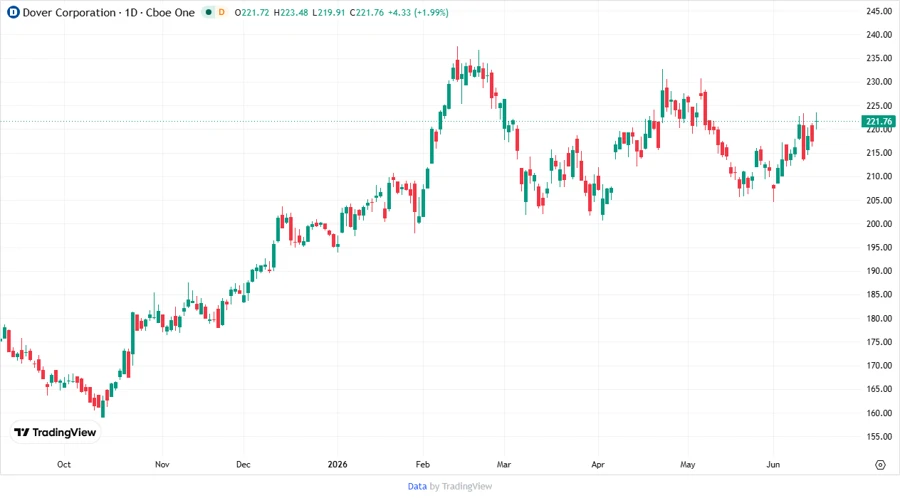
Analyst Price Targets
Analyst estimates showcase a strong belief in Dover's upward trajectory with balanced price expectations.
| High | Low | Median | Consensus |
|---|---|---|---|
| 279 | 205 | 250 | 242.73 |
Analyst Sentiment
The analyst sentiment reflects a predominant inclination towards a buy recommendation, indicating confidence in Dover Corporation’s market position.
| Recommendation | Count | Visualization |
|---|---|---|
| Strong Buy | 0 | |
| Buy | 18 | |
| Hold | 10 | |
| Sell | 0 | |
| Strong Sell | 0 |
Conclusion
Dover Corporation presents a stable foundational structure with room for profitability growth aided by innovative approaches in technology. While the debt metrics indicate an area for cautious observation, strong asset management and strategic market positioning bolster its financial outlook. Analyst confidence is high, recommending a buy, which aligns with the positive forecast trends for industrial machinery sectors. Continued operations in sustainable technologies could further enhance Dover’s competitive edge.
Smart Data Insight
Master the Perfect Entry & Exit for this Stock
Don't leave your profits to chance. Historically, this stock follows specific seasonal patterns that institutional traders use to maximize returns.
- ✅ Identify the "Golden Buying Window"
- ✅ Avoid high-risk correction cycles
- ✅ Backtested data from the last 20+ years