
July 23, 2026 a 03:15 pm
DOV: Fibonacci Analysis - Dover Corporation
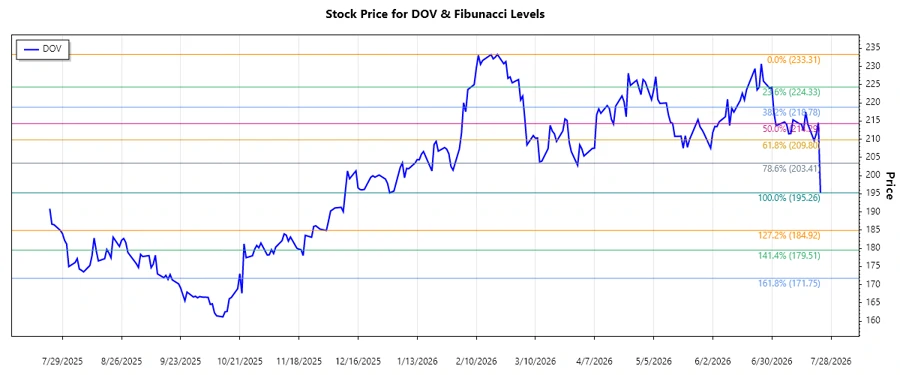
The stock of Dover Corporation has shown a consistent performance, supported by its diversified business segments. Recently, the stock has experienced a downward trend, reflecting broader market pressures but also potential buying opportunities. Market analysts are keenly observing this trend to evaluate the possible rebound points.
Fibonacci Analysis
| Start Date | End Date | High Price | High Date | Low Price | Low Date |
|---|---|---|---|---|---|
| 2026-02-20 | 2026-07-23 | $233.31 | 2026-02-20 | $195.265 | 2026-07-23 |
| Fibonacci Level | Price Level |
|---|---|
| 0.236 | $224.46 |
| 0.382 | $218.66 |
| 0.5 | $214.29 |
| 0.618 | $209.91 |
| 0.786 | $203.45 |
The current price is within the 0.786 retracement level, suggested as a potential support zone. This indicates a possible area of consolidation or a reversal point for Dover Corporation's stock price, drawing attention from traders for potential entry points.
Conclusion
The Dover Corporation has seen a downward price momentum recently, primarily due to external market conditions and sector rotation. However, its solid underlying business model and steady revenue streams provide a safety net for investors. The identified Fibonacci retracement levels could act as potential support zones, but investors should stay cautious given volatility in broader markets. Analysts view this phase as a possible accumulation period, anticipating a rebound if market conditions stabilize. Hence, monitoring industry trends and macroeconomic indicators will be crucial in the coming months.
Smart Data Insight
Master the Perfect Entry & Exit for this Stock
Don't leave your profits to chance. Historically, this stock follows specific seasonal patterns that institutional traders use to maximize returns.
- ✅ Identify the "Golden Buying Window"
- ✅ Avoid high-risk correction cycles
- ✅ Backtested data from the last 20+ years