May 05, 2026 a 10:15 am

DOV: Fibonacci Analysis - Dover Corporation
Dover Corporation has shown resilience in its diverse industrial segments, which include engineered products and clean energy solutions. With strong market positioning and innovative solutions, the stock has experienced both challenges and growth opportunities. The diverse product offerings contribute to its market robustness, but market volatility and global economic factors are constraints. The recent data reflects an upward trend, indicating potential growth if the market conditions remain favorable.
Fibonacci Analysis
| Detail | Value |
|---|---|
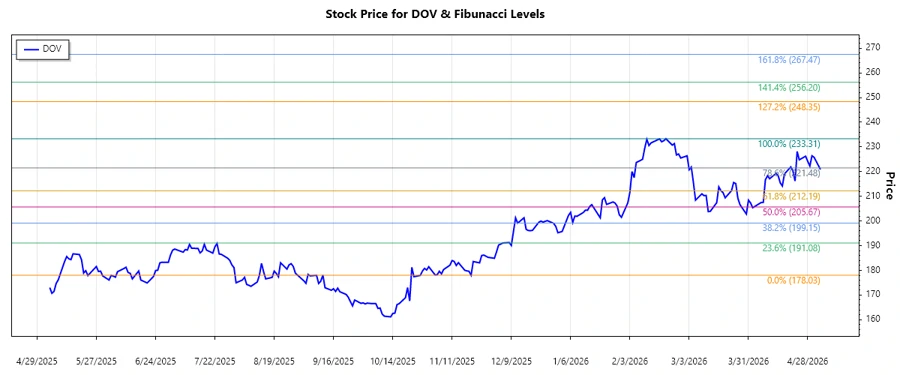
| Start Date | 2025-11-20 |
| End Date | 2026-04-23 |
| High Price (Date) | $233.31 (2026-02-20) |
| Low Price (Date) | $178.03 (2025-11-20) |
| Fibonacci Level 0.236 | $192.18 |
| Fibonacci Level 0.382 | $201.05 |
| Fibonacci Level 0.500 | $205.67 |
| Fibonacci Level 0.618 | $210.29 |
| Fibonacci Level 0.786 | $217.08 |
| Current Price | $225.79 |
| Retracement Zone | None |
| Interpretation | The current price is above the highest Fibonacci level, suggesting a continued upward trend with potential support at the higher levels if corrections occur. |
Conclusion
Dover Corporation has demonstrated solid growth potential with its diversified portfolio. The upward trend suggests confidence in the market, driven by its innovations in sustainable energy and industrial solutions. However, investors should be cautious of market fluctuations which can impact the stock sharply. The Fibonacci analysis underscores a potential for sustained growth if the retracement levels continue to hold as support. The market outlook remains cautiously optimistic, with a blend of innovation-driven growth and external economic factors holding sway.
Smart Data Insight
Master the Perfect Entry & Exit for this Stock
Don't leave your profits to chance. Historically, this stock follows specific seasonal patterns that institutional traders use to maximize returns.
- ✅ Identify the "Golden Buying Window"
- ✅ Avoid high-risk correction cycles
- ✅ Backtested data from the last 20+ years