January 10, 2026 a 10:15 am

DOV: Fibonacci Analysis - Dover Corporation
The Dover Corporation stock has shown solid performance, being indicative of its resilient business model amidst diverse market segments. With a relatively stable uptrend in recent months, analyzing its continuation using Fibonacci levels can identify potential areas of support or resistance. Investors should consider the market context and economic indicators influencing the industrial and manufacturing sectors when evaluating Dover's stock. Expecting movements within identified retracement levels can guide investment entries or exits.
Fibonacci Analysis
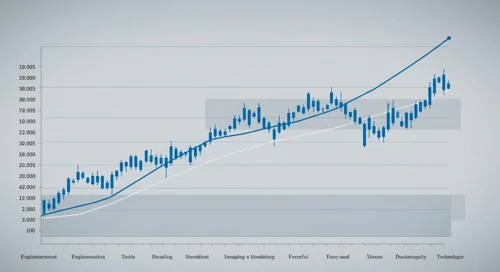
The analysis of Dover Corporation's stock indicates a strong upward trend from October 2025 to January 2026 based on historical price data. Utilizing the high of 206.43 on February 20, 2025, and the low of 161.16 on October 13, 2025, we can discern crucial Fibonacci retracement levels.
| Start Date | End Date | High Price | Low Price | Current Price |
|---|---|---|---|---|
| 2025-10-13 | 2026-01-09 | $206.43 (2025-02-20) | $161.16 (2025-10-13) | $201.89 (2026-01-09) |
| Fibonacci Level | Price |
|---|---|
| 0.236 | $173.17 |
| 0.382 | $184.10 |
| 0.5 | $193.80 |
| 0.618 | $203.50 |
| 0.786 | $215.63 |
The current price of $201.89 is within the 0.5 and 0.618 retracement zone, which indicates a critical support area. Should the stock maintain above the 0.5 level, momentum may continue upward, suggesting potential entry points for investors.
Conclusion
Dover Corporation's stock is currently in an upward trend driven by strong financial performance across its diversified segments. The Fibonacci analysis suggests bullish momentum could persist if the current price stays above the 0.5 retracement level. Analysts might find potential in this stock, with technical levels aiding in identifying entry and exit points. Nevertheless, economic volatility and market conditions may introduce risks, necessitating careful monitoring. As the company operates across dynamic sectors, external macroeconomic factors could also impact stock movement.