February 09, 2026 a 12:47 pm

DOV: Dividend Analysis - Dover Corporation
Dover Corporation, operating in the industrials sector, presents a solid dividend profile with a stable track record of 44 consecutive years without a cut or suspension since 1984. Despite a modest dividend yield of 1.12%, the company maintains reliable payouts, reflecting its reliable cash flow management.
📊 Overview
The following table provides an overview of Dover Corporation's dividend specifics and sector alignment:
| Metric | Value |
|---|---|
| Sector | Industrials |
| Dividend yield | 1.12% |
| Current dividend per share | 2.06 USD |
| Dividend history | 44 years |
| Last cut or suspension | 1984 |
🗣️ Dividend History
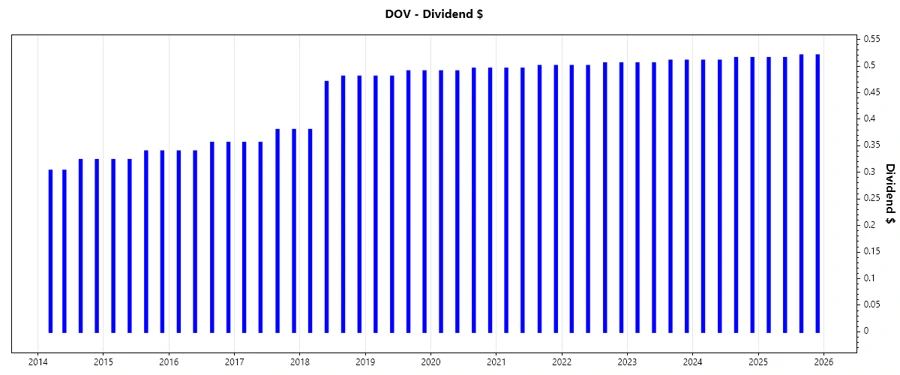
Dover Corporation's dividend history is crucial as it reflects the company's commitment to returning value to shareholders consistently. A stable dividend history can be indicative of strong management and operational stability.
| Year | Dividend per Share (USD) |
|---|---|
| 2025 | 2.07 |
| 2024 | 2.05 |
| 2023 | 2.03 |
| 2022 | 2.01 |
| 2021 | 1.99 |
📈 Dividend Growth
Understanding dividend growth trends is vital for assessing the long-term viability of the dividend policy. A steady growth rate indicates the company's capability to enhance shareholder value through increasing payouts.
| Time | Growth |
|---|---|
| 3 years | 0.99% |
| 5 years | 0.99% |
The average dividend growth is 0.99% over 5 years. This showcases moderate but steady dividend growth.
⚠️ Payout Ratio
The payout ratio is a critical measure of dividend sustainability, showcasing the proportion of earnings and free cash flow allocated to dividends.
| Key Figure | Ratio |
|---|---|
| EPS-based | 25.87% |
| Free cash flow-based | 25.37% |
The EPS-based payout ratio of 25.87% and the free cash flow-based ratio of 25.37% imply a conservative and sustainable approach, suggesting ample room for future dividend increases.
Cashflow & Capital Efficiency
Efficient capital allocation and robust cash flow generation underpin sustainable dividend policies and reinvestment capabilities.
| Metric | 2023 | 2024 | 2025 |
|---|---|---|---|
| Free Cash Flow Yield | 5.32% | 2.25% | 4.17% |
| Earnings Yield | 4.91% | 10.44% | 4.08% |
| CAPEX to Operating Cash Flow | 14.41% | 22.39% | 16.50% |
| Stock-based Compensation to Revenue | 0.41% | 0.52% | 0.54% |
| Free Cash Flow / Operating Cash Flow Ratio | 85.59% | 77.61% | 83.54% |
The data indicates robust cash flow stability and capital efficiency, highlighting Dover's ability to fund dividends and reinvest in growth initiatives efficiently.
Balance Sheet & Leverage Analysis
A strong balance sheet provides a buffer against economic volatility and supports sustainable dividend policies by ensuring liquidity and financial flexibility.
| Metric | 2023 | 2024 | 2025 |
|---|---|---|---|
| Debt-to-Equity | 72.04% | 45.35% | 44.94% |
| Debt-to-Assets | 32.42% | 25.21% | 24.79% |
| Debt-to-Capital | 41.87% | 31.20% | 31.01% |
| Net Debt to EBITDA | 2.10 | 0.59 | 0.89 |
| Current Ratio | 1.40 | 2.04 | 1.79 |
| Quick Ratio | 0.90 | 1.52 | 1.28 |
The company exhibits a sound financial structure with manageable leverage, ensuring dividend sustainability and financial resilience.
Fundamental Strength & Profitability
High profitability and effective capital management empower a firm to support dividend payments and pursue growth opportunities.
| Metric | 2023 | 2024 | 2025 |
|---|---|---|---|
| Return on Equity | 20.70% | 38.79% | 14.77% |
| Return on Assets | 9.31% | 21.56% | 8.15% |
| Margins: Net | 13.75% | 34.82% | 13.52% |
| Margins: EBIT | 16.32% | 24.38% | 18.34% |
| Margins: EBITDA | 20.29% | 28.74% | 23.03% |
| Margins: Gross | 37.32% | 38.20% | 39.77% |
| Research & Development to Revenue | 0.00% | 1.93% | 1.04% |
Dover's consistent returns and healthy profitability margins underpin its ability to maintain and potentially increase dividend payouts while investing in growth.
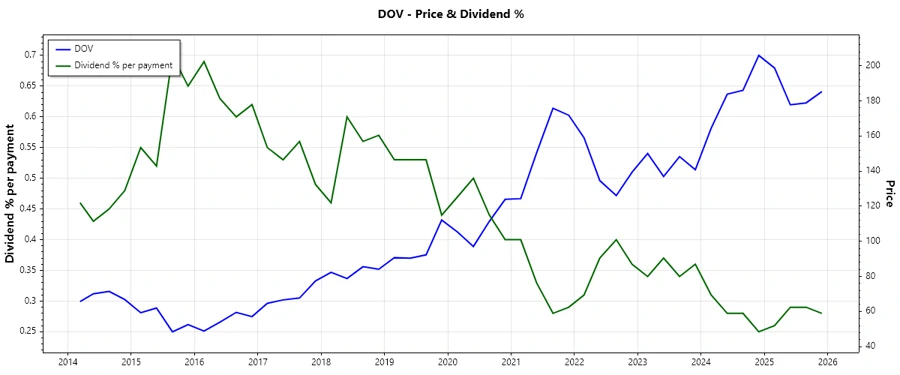
Price Development
Dividend Scoring System
| Category | Score | Bar |
|---|---|---|
| Dividend yield | 3 | |
| Dividend Stability | 5 | |
| Dividend growth | 4 | |
| Payout ratio | 5 | |
| Financial stability | 4 | |
| Dividend continuity | 5 | |
| Cashflow Coverage | 4 | |
| Balance Sheet Quality | 4 |
Overall Score: 34/40
Rating
Dover Corporation's solid financial health, strong dividend stability, and prudent payout ratio contribute to a robust dividend profile. While the dividend yield is moderate, its consistent history and capacity for growth make it a suitable candidate for long-term dividend investors seeking reliability and steady income.
Smart Data Insight
Master the Perfect Entry & Exit for this Stock
Don't leave your profits to chance. Historically, this stock follows specific seasonal patterns that institutional traders use to maximize returns.
- ✅ Identify the "Golden Buying Window"
- ✅ Avoid high-risk correction cycles
- ✅ Backtested data from the last 20+ years