February 05, 2026 a 03:32 pm

DOV: Dividend Analysis - Dover Corporation
Dover Corporation continues to maintain a solid dividend track record with over four decades of consecutive payments. The company's strategy of consistent dividend growth and stable financials makes it an attractive choice for dividend-focused investors. However, the relatively modest yield and slow growth warrant a cautious approach and regular performance reviews.
📊 Overview
The overview section highlights key financial metrics crucial for assessing the sustainability and attractiveness of Dover Corporation’s dividend policy.
| Metric | Value |
|---|---|
| Sector | Machinery |
| Dividend yield | 1.12% |
| Current dividend per share | 2.06 USD |
| Dividend history | 44 years |
| Last cut or suspension | 1984 |
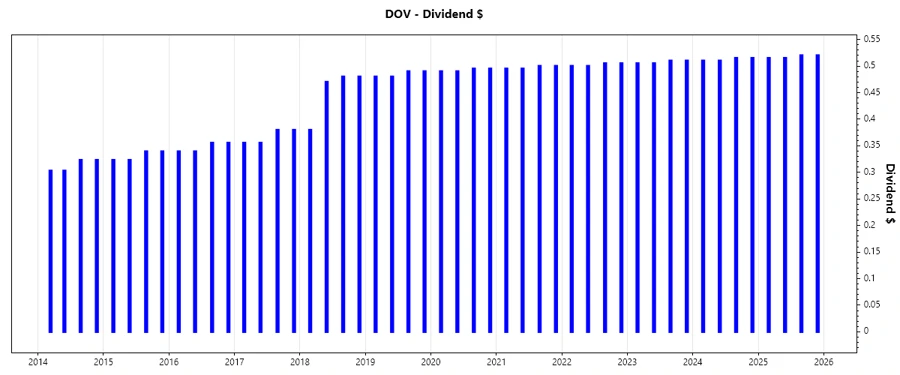
🗣️ Dividend History
The continuous growth of dividends over 44 years demonstrates Dover’s commitment to returning value to shareholders, reflecting the company's financial health and management's prudent capital allocation strategy.
| Year | Dividend Per Share (USD) |
|---|---|
| 2025 | 2.07 |
| 2024 | 2.05 |
| 2023 | 2.03 |
| 2022 | 2.01 |
| 2021 | 1.99 |
📈 Dividend Growth
Assessing the dividend growth rate is critical as it signals the company's future potential to increase shareholder returns. Despite modest growth, the consistent upward trend is positive.
| Time | Growth |
|---|---|
| 3 years | 0.99% |
| 5 years | 0.99% |
The average dividend growth is 0.99% over 5 years. This shows moderate but steady dividend growth.
⚠️ Payout Ratio
The payout ratio is a critical measure of dividend coverage, indicating whether earnings sufficiently cover dividend payments. Dover exhibits a healthy payout ratio, ensuring dividend sustainability.
| Key figure ratio | Value |
|---|---|
| EPS-based | 25.87% |
| Free cash flow-based | 25.37% |
The EPS-based payout ratio of 25.87% and FCF-based payout ratio of 25.37% indicate strong coverage and a conservative approach to safeguarding dividends.
✅ Cashflow & Capital Efficiency
Cashflow measures help gauge a company's ability to sustain operations and dividend payouts. These metrics underscore Dover’s solid operational efficiency and effective capital allocation.
| Metric | 2023 | 2024 | 2025 |
|---|---|---|---|
| Free Cash Flow Yield | 5.32% | 2.25% | 4.17% |
| Earnings Yield | 4.91% | 10.44% | 4.08% |
| CAPEX to Operating Cash Flow | 14.41% | 22.39% | 16.50% |
| Stock-based Compensation to Revenue | 0.41% | 0.52% | 0.54% |
| Free Cash Flow / Operating Cash Flow Ratio | 0.86 | 0.78 | 0.83 |
The consistent free cash flow and strong capital efficiency measures suggest robust financial performance conducive to long-term growth.
📉 Balance Sheet & Leverage Analysis
Understanding leverage is essential for evaluating the risk profile and financial sustainability of a company's operations. Dover's balance sheet ratios indicate sound leverage management.
| Metric | 2023 | 2024 | 2025 |
|---|---|---|---|
| Debt-to-Equity | 0.72 | 0.45 | 0.45 |
| Debt-to-Assets | 0.32 | 0.25 | 0.25 |
| Debt-to-Capital | 0.42 | 0.31 | 0.31 |
| Net Debt to EBITDA | 2.10 | 0.59 | 0.89 |
| Current Ratio | 1.40 | 2.04 | 1.79 |
| Quick Ratio | 0.90 | 1.52 | 1.28 |
| Financial Leverage | 2.22 | 1.80 | 1.81 |
These leverage ratios reflect a stable financial structure, with manageable risk levels and adequate liquidity.
📊 Fundamental Strength & Profitability
Profitability ratios are indicative of the company's operational efficiency. With consistent returns, Dover showcases its ability to maintain profitability.
| Metric | 2023 | 2024 | 2025 |
|---|---|---|---|
| Return on Equity | 20.70% | 38.79% | 14.77% |
| Return on Assets | 9.31% | 21.56% | 8.15% |
| Net Margin | 13.75% | 34.82% | 13.52% |
| EBIT Margin | 16.32% | 24.38% | 18.34% |
| EBITDA Margin | 20.29% | 28.74% | 23.03% |
| Gross Margin | 37.32% | 38.20% | 39.77% |
| R&D to Revenue | N/A | 1.93% | 1.04% |
Dover's strong fundamentals and enduring profitability reflect operational success, boding well for continued shareholder returns.
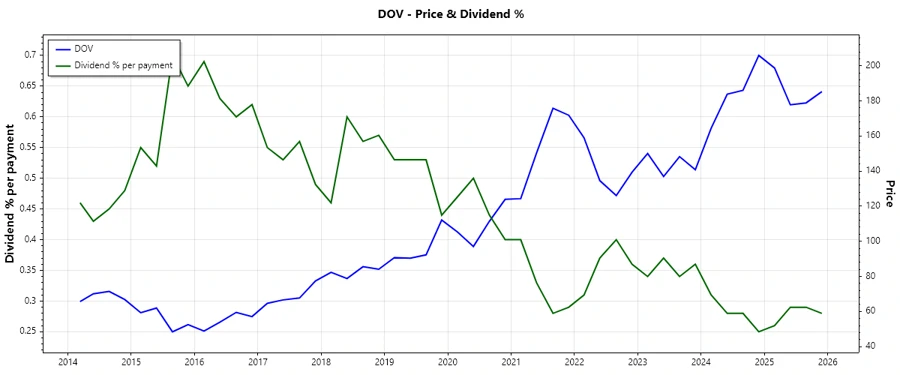
📊 Price Development
Dividend Scoring System
An evaluation of Dover’s dividend metrics against our comprehensive scoring system reveals valuable insights for potential increment in investor yield.
| Criterion | Score (out of 5) | Indicator |
|---|---|---|
| Dividend yield | 3 | |
| Dividend Stability | 5 | |
| Dividend growth | 3 | |
| Payout ratio | 5 | |
| Financial stability | 4 | |
| Dividend continuity | 5 | |
| Cashflow Coverage | 4 | |
| Balance Sheet Quality | 4 |
Total Score: 33/40
✅ Rating
Dover Corporation presents a stable dividend history with reliable growth, marking it a solid choice for dividend-focused portfolios. However, given the moderate dividend yield and slow growth, it is recommended for investors seeking steady income with low-risk exposure rather than high-velocity capital appreciation.