November 24, 2025 a 03:31 pm


DOV: Dividend Analysis - Dover Corporation
Dover Corporation exhibits a steadfast dividend policy that spans over four decades without a cut or suspension since 1984. This highlights a firm commitment to returning value to shareholders. The current dividend yield is modest; however, the long history of dividend payments adds credibility. The payout ratios based on EPS and free cash flow suggest a manageable distribution level, ensuring room for growth and sustainability.
📊 Overview
Dover Corporation operates in a dynamic sector, demonstrating a consistent ability to maintain and grow its dividend payout. Its dividend yield, while not the highest in the market at 1.13%, is bolstered by a stable history of 44 years without cuts.
| Metric | Detail |
|---|---|
| Sector | Industrial Conglomerates |
| Dividend yield | 1.13% |
| Current dividend per share | 2.06 USD |
| Dividend history | 44 years |
| Last cut or suspension | 1984 |
📈 Dividend History
Dover Corporation's dividend history reflects financial resilience and consistent shareholder value. This track record can appeal to income-focused investors seeking reliability over high initial yields.
| Year | Dividend per Share (USD) |
|---|---|
| 2025 | 2.070 |
| 2024 | 2.050 |
| 2023 | 2.030 |
| 2022 | 2.010 |
| 2021 | 1.990 |
📉 Dividend Growth
The company's moderate dividend growth indicates a focus on sustainable payments rather than aggressive hikes. This approach aligns well with long-term strategic goals.
| Time | Growth |
|---|---|
| 3 years | 0.99% |
| 5 years | 1.11% |
The average dividend growth is 1.11% over 5 years. This shows moderate but steady dividend growth.
✅ Payout Ratio
The payout ratio is an important indicator for dividend sustainability. It reveals how much of the earnings and cash flow are distributed to shareholders.
| Key figure | Ratio |
|---|---|
| EPS-based | 12.55% |
| Free cash flow-based | 49.62% |
A low EPS payout ratio of 12.55% suggests ample room for maintaining and potentially increasing dividends. The FCF payout ratio is sensible at 49.62%, indicating healthy coverage of dividend payments by cash flows.
💰 Cashflow & Capital Efficiency
An analysis of cash flow and capital efficiency helps assess the company's profitability and long-term financial health.
| Metric | 2024 | 2023 | 2022 |
|---|---|---|---|
| Free Cash Flow Yield | 2.25% | 5.32% | 3.03% |
| Earnings Yield | 10.44% | 4.91% | 5.51% |
| CAPEX to Operating Cash Flow | 22.39% | 14.41% | 27.42% |
| Stock-based Compensation to Revenue | 0.52% | 0.41% | 0.39% |
| Free Cash Flow / Operating Cash Flow Ratio | 77.61% | 85.59% | 72.58% |
Dover Corporation's cash flow stability and capital returns are solid, though with slight variations year by year. A higher CAPEX to cash flow ratio could point to strategic reinvestments in growth initiatives.
📋 Balance Sheet & Leverage Analysis
Reviewing key leverage ratios provides insight into the company's financial structure and obligations.
| Metric | 2024 | 2023 | 2022 |
|---|---|---|---|
| Debt-to-Equity | 0.45 | 0.72 | 0.91 |
| Debt-to-Assets | 0.25 | 0.32 | 0.36 |
| Debt-to-Capital | 0.31 | 0.42 | 0.48 |
| Net Debt to EBITDA | 0.59 | 2.10 | 2.19 |
| Current Ratio | 2.04 | 1.40 | 1.23 |
| Quick Ratio | 1.52 | 0.90 | 0.74 |
| Financial Leverage | 1.80 | 2.22 | 2.54 |
The decreasing leverage ratios denote improved financial structure with better managed debt levels, boosting the company's capacity to withstand financial pressure.
📈 Fundamental Strength & Profitability
The fundamental and profitability metrics are essential indicators of a company's operational efficiency and market competency.
| Metric | 2024 | 2023 | 2022 |
|---|---|---|---|
| Return on Equity | 38.79% | 20.70% | 24.85% |
| Return on Assets | 21.56% | 9.31% | 9.78% |
| Margins: Net | 34.82% | 13.75% | 13.58% |
| Margins: EBIT | 24.38% | 16.32% | 16.66% |
| Margins: EBITDA | 28.74% | 20.29% | 20.43% |
| Gross Profit Margin | 38.20% | 37.32% | 37.03% |
| Research & Development to Revenue | 1.93% | 0.00% | 0.00% |
Improved returns and consistent margins highlight operational strength. The focus on R&D also signals strategic efforts to drive innovation and new revenue streams.
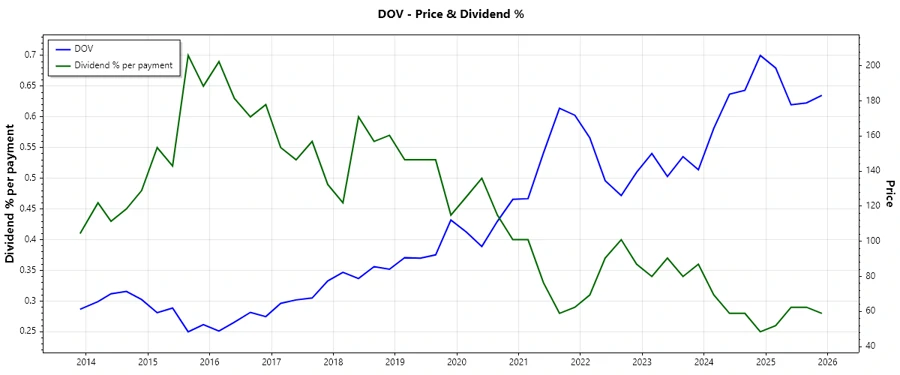
🔍 Price Development
🗣️ Dividend Scoring System
| Category | Score | |
|---|---|---|
| Dividend yield | 3 | |
| Dividend Stability | 5 | |
| Dividend growth | 3 | |
| Payout ratio | 4 | |
| Financial stability | 4 | |
| Dividend continuity | 5 | |
| Cashflow Coverage | 4 | |
| Balance Sheet Quality | 4 |
Total Score: 32/40
🔍 Rating
Overall, Dover Corporation's dividend profile reflects a reliable and steady investment opportunity. The firm has demonstrated strong stability in its distribution, with flexibility for growth. However, the yield remains relatively modest. As such, it suits conservative dividend investors who prioritize consistency over high returns. The company's operational backbone seems robust, and its financials affirm a well-managed leverage structure.
Smart Data Insight
Master the Perfect Entry & Exit for this Stock
Don't leave your profits to chance. Historically, this stock follows specific seasonal patterns that institutional traders use to maximize returns.
- ✅ Identify the "Golden Buying Window"
- ✅ Avoid high-risk correction cycles
- ✅ Backtested data from the last 20+ years