November 08, 2025 a 02:47 am

DOV: Dividend Analysis - Dover Corporation
Dover Corporation presents a stable and modest dividend with consistent growth over the years. The company's commitment to maintaining a reliable dividend payout makes it an attractive option for long-term income-focused investors. While the current dividend yield is low, the sustainability and growth potential provide appealing prospects.
📊 Overview
Dover Corporation operates within the industrial sector, offering a dividend yield of 1.15% with a current dividend of $2.06 per share. With a commendable dividend history of 44 years and no recent cuts or suspensions, the company demonstrates robust dividend sustainability.
| Metric | Value |
|---|---|
| Sector | Industrial |
| Dividend yield | 1.15% |
| Current dividend per share | $2.06 |
| Dividend history | 44 years |
| Last cut or suspension | None |
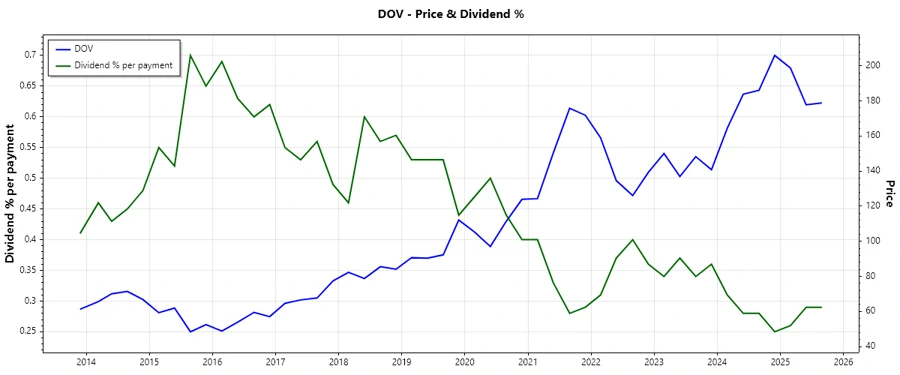
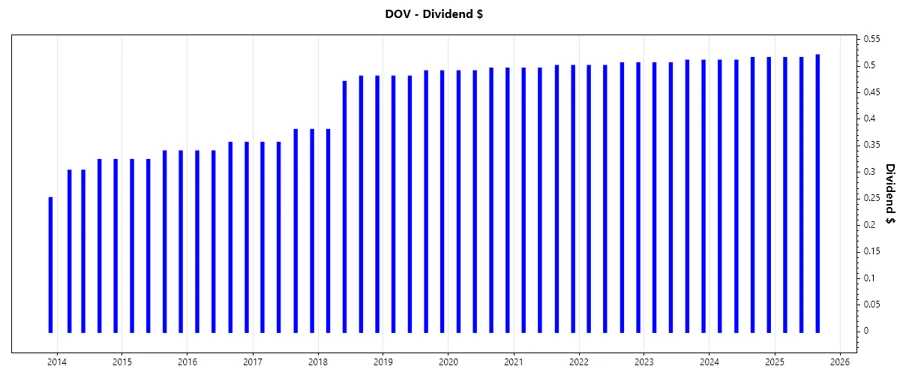
📈 Dividend History
Dover’s long dividend history is indicative of its consistent financial performance and commitment to returning value to shareholders. This stability is critical for investors seeking reliable income from dividends.
| Year | Dividend per Share (USD) |
|---|---|
| 2025 | 1.55 |
| 2024 | 2.05 |
| 2023 | 2.03 |
| 2022 | 2.01 |
| 2021 | 1.99 |
🚀 Dividend Growth
Dover has achieved modest dividend growth, indicative of steady company performance and its ability to safely increase returns to shareholders.
| Time | Growth |
|---|---|
| 3 years | 0.99% |
| 5 years | 1.11% |
The average dividend growth is 1.11% over 5 years. This shows moderate but steady dividend growth.
📉 Payout Ratio
The payout ratio provides insights into the sustainability of dividends. A lower EPS-based payout ratio of 12.55% suggests significant earnings retention, promoting reinvestment and future growth, while the FCF-based ratio at 49.62% indicates sufficient cash availability to cover dividends.
| Key figure | Ratio |
|---|---|
| EPS-based | 12.55% |
| Free cash flow-based | 49.62% |
💵 Cashflow & Capital Efficiency
Evaluating cash flow and capital efficiency is crucial for understanding dividend sustainability and operational productivity. Dover's cash flow efficiencies support ongoing dividend payments and signify operational robustness.
| Year | 2024 | 2023 | 2022 |
|---|---|---|---|
| Free Cash Flow Yield | 2.25% | 5.32% | 3.03% |
| Earnings Yield | 10.44% | 4.91% | 5.51% |
| CAPEX to Operating Cash Flow | 22.39% | 14.41% | 27.42% |
| Stock-based Compensation to Revenue | 0.52% | 0.41% | 0.39% |
| Free Cash Flow / Operating Cash Flow Ratio | 77.61% | 85.59% | 72.58% |
🗣️ Balance Sheet & Leverage Analysis
Analyzing leverage and balance sheet metrics ensures understanding of the company's financial stability. Dover presents an adequate debt management strategy, which bodes well for managing economic downturns.
| Metric | 2024 | 2023 | 2022 |
|---|---|---|---|
| Debt-to-Equity | 0.45 | 0.72 | 0.91 |
| Debt-to-Assets | 0.25 | 0.32 | 0.36 |
| Debt-to-Capital | 0.31 | 0.42 | 0.48 |
| Net Debt to EBITDA | 0.84 | 2.10 | 2.19 |
| Current Ratio | 2.04 | 1.40 | 1.23 |
| Quick Ratio | 1.52 | 0.90 | 0.74 |
| Financial Leverage | 1.80 | 2.22 | 2.54 |
✅ Fundamental Strength & Profitability
Profitability and fundamental strength assessments highlight Dover’s capacity for sustained profitability and growth, crucial for attractive shareholder returns.
| Metric | 2024 | 2023 | 2022 |
|---|---|---|---|
| Return on Equity | 38.79% | 20.70% | 24.85% |
| Return on Assets | 21.56% | 9.31% | 9.78% |
| Net Margin | 34.82% | 13.75% | 13.58% |
| EBIT Margin | 24.38% | 16.32% | 16.66% |
| EBITDA Margin | 28.74% | 20.29% | 20.43% |
| Gross Margin | 38.20% | 37.32% | 37.03% |
| Research & Development to Revenue | 1.93% | - | - |
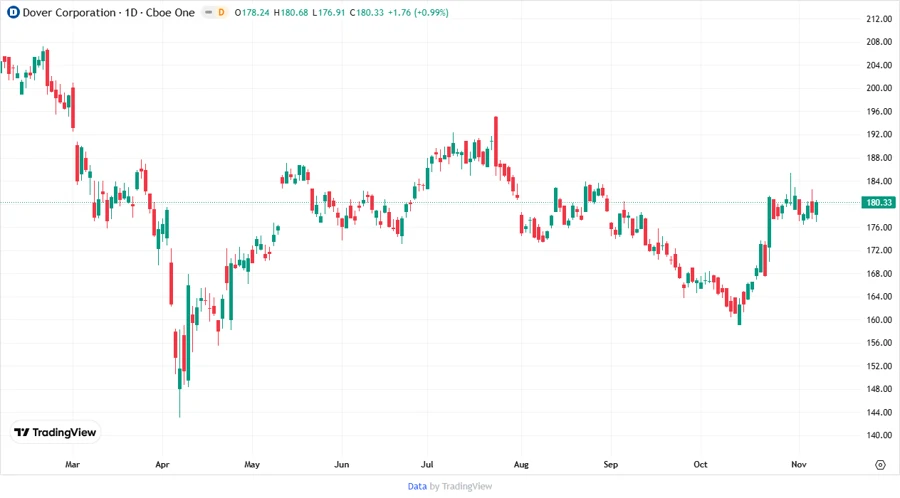
📉 Price Development
🏆 Dividend Scoring System
| Category | Score | Bar |
|---|---|---|
| Dividend yield | 3 | |
| Dividend stability | 5 | |
| Dividend growth | 3 | |
| Payout ratio | 4 | |
| Financial stability | 4 | |
| Dividend continuity | 5 | |
| Cashflow coverage | 3 | |
| Balance sheet quality | 4 |
Total Score: 31/40
🔍 Rating
Overall, Dover Corporation achieves a high rating with a solid track record in dividend payouts, marginal growth in dividends, and robust financial health. Suitable for investors seeking stable dividend income with added confidence from the company’s strong financial metrics and historical performance.
Smart Data Insight
Master the Perfect Entry & Exit for this Stock
Don't leave your profits to chance. Historically, this stock follows specific seasonal patterns that institutional traders use to maximize returns.
- ✅ Identify the "Golden Buying Window"
- ✅ Avoid high-risk correction cycles
- ✅ Backtested data from the last 20+ years