October 21, 2025 a 11:32 am

DOV: Dividend Analysis - Dover Corporation
Dover Corporation, a significant player with a long standing dividend history, presents a captivating dividend profile that appeals to income-focused investors. The corporation's strategic dividend policies demonstrate a commitment to returning wealth to shareholders while maintaining operational efficiency. With an impressive history of consistent increases, it's fundamental to understand the nuanced facets of its dividend performance.
📊 Overview
Dover Corporation operates within the Industrials sector, exemplifying a focus on consistent dividend policies. The current dividend yield stands at 1.15%, with a robust annual dividend per share of $2.06. The company's commitment to shareholders is evidenced by a 44-year track record in dividend history. Despite global economic fluctuations, Dover has impressively avoided recent cuts or suspensions.
| Metric | Details |
|---|---|
| Sector | Industrials |
| Dividend yield | 1.15% |
| Current dividend per share | $2.06 |
| Dividend history | 44 years |
| Last cut or suspension | None |
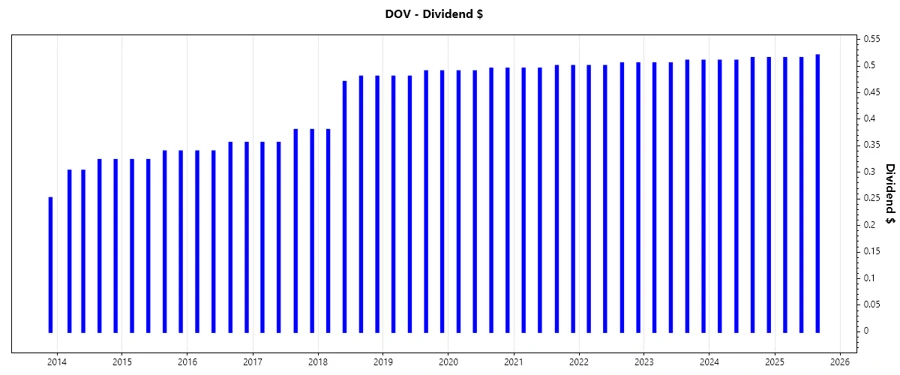
📈 Dividend History
Dividend history is a crucial aspect for assessing a company's reliability in rewarding its investors. A company's consistent dividend growth and history reflect its financial health and commitment to shareholder value. Dover Corporation showcases a remarkable track record, evidenced by decades of uninterrupted payments.
| Year | Dividend per Share |
|---|---|
| 2025 | $1.55 |
| 2024 | $2.05 |
| 2023 | $2.03 |
| 2022 | $2.01 |
| 2021 | $1.99 |
📈 Dividend Growth
Understanding dividend growth sheds light on a corporation's future payout potential and its financial stability. Dover has cultivated a sustainable growth model with some increment in their dividend payouts.
| Time | Growth |
|---|---|
| 3 years | 0.99% |
| 5 years | 1.11% |
The average dividend growth is 1.11% over 5 years. This shows moderate but steady dividend growth, highlighting Dover's strategic approach to enhance shareholder returns progressively.
💹 Payout Ratio
The payout ratio is an insightful measure to comprehend the dividends as a percentage of Dover's earnings, indicating their ability to sustain dividend payments over time. A balance is essential for long-term stability.
| Key figure | Ratio |
|---|---|
| EPS-based | 12.30% |
| Free cash flow-based | 50.64% |
The EPS-based payout ratio of 12.30% demonstrates a conservative payout, ensuring ample room for reinvestment. Meanwhile, a free cash flow payout ratio of 50.64% reflects a stable yet progressive dividend policy.
📜 Cashflow & Capital Efficiency
Analyzing cash flow alongside capital efficiency provides insight into how effectively a company can generate cash flows relative to its capital investments. These metrics are crucial for evaluating Dover Corporation's operational efficiency and capacity for sustaining dividends.
| Year | 2024 | 2023 | 2022 |
|---|---|---|---|
| Free Cash Flow Yield | 2.25% | 5.32% | 3.03% |
| Earnings Yield | 10.44% | 4.91% | 5.51% |
| CAPEX to Operating Cash Flow | 22.38% | 14.41% | 27.42% |
| Stock-based Compensation to Revenue | 0.52% | 0.41% | 0.39% |
| Free Cash Flow / Operating Cash Flow Ratio | 77.61% | 85.59% | 72.58% |
Dover's capability to manage cash flows efficiently is reinforced by a stable Free Cash Flow yield. The consistent Earnings Yield suggests robust profitability and financial health. Capital allocation remains sensible, fostering future business expansions and stakeholder returns.
📉 Balance Sheet & Leverage Analysis
The balance sheet analysis gauges financial health through leverage ratios, presenting insights on a company's debt levels relative to equity and assets. Adequate leverage signifies efficient capital utilization for shareholder value enhancement without undue strain on the company's finances.
| Year | 2024 | 2023 | 2022 |
|---|---|---|---|
| Debt-to-Equity | 45.35% | 72.04% | 90.68% |
| Debt-to-Assets | 25.21% | 32.42% | 35.67% |
| Debt-to-Capital | 31.20% | 41.87% | 47.55% |
| Net Debt to EBITDA | 0.59 | 2.10 | 2.19 |
| Current Ratio | 2.04 | 1.40 | 1.23 |
| Quick Ratio | 1.52 | 0.90 | 0.74 |
| Financial Leverage | 1.79 | 2.22 | 2.54 |
Dover Corporation exhibits a commendable reduction in leverage ratios, underscoring improved capital structure and financial resilience. The stability in current and quick ratios suggests a solid liquidity cushion, crucial for business continuity and risk mitigation.
💼 Fundamental Strength & Profitability
The assessment of fundamental strength and profitability encapsulates Dover’s ability to generate cash and profit from its core operations. Metrics such as return ratios and margins highlight operational excellence and strategic efficiency.
| Year | 2024 | 2023 | 2022 |
|---|---|---|---|
| Return on Equity | 38.78% | 20.70% | 24.85% |
| Return on Assets | 21.56% | 9.31% | 9.78% |
| Return on Invested Capital | 8.93% | 10.84% | 11.96% |
| Net Margin | 34.82% | 13.75% | 13.58% |
| EBIT Margin | 24.38% | 16.32% | 16.66% |
| EBITDA Margin | 28.74% | 20.29% | 20.43% |
| Gross Margin | 38.20% | 37.32% | 37.03% |
| R&D to Revenue | 0.00% | 0.00% | 0.00% |
Dover demonstrates outstanding return measures indicative of strategic operational processes. The strength in profit margins confirms well-executed cost management and efficient top-line performance, ensuring sustained shareholder returns.
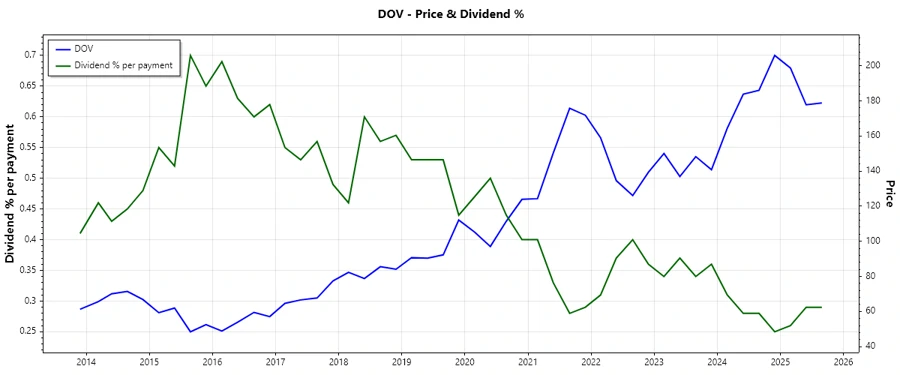
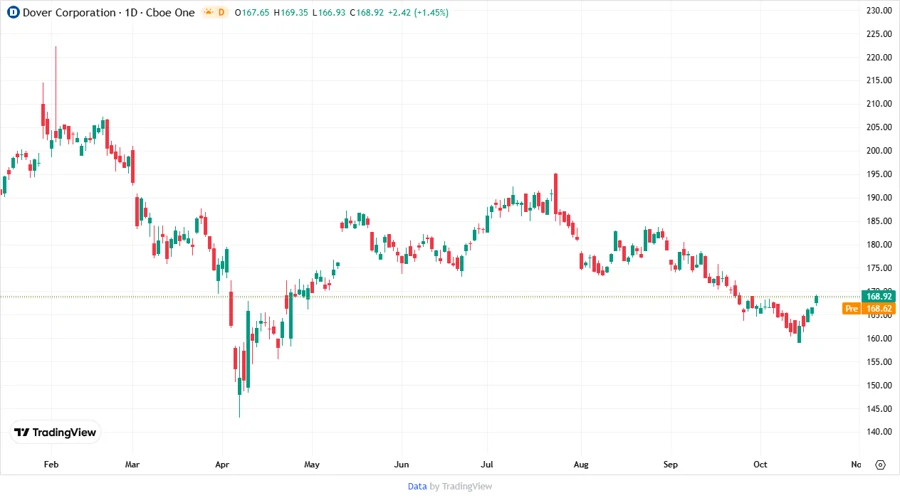
📈 Price Development
🔢 Dividend Scoring System
| Criteria | Score | Bar |
|---|---|---|
| Dividend yield | 3 | |
| Dividend Stability | 5 | |
| Dividend growth | 2 | |
| Payout ratio | 4 | |
| Financial stability | 4 | |
| Dividend continuity | 5 | |
| Cashflow Coverage | 4 | |
| Balance Sheet Quality | 4 |
Overall Score: 31 out of 40
✅ Rating
In conclusion, Dover Corporation is a compelling dividend stock with a strong foundation and exceptional stability. Despite a modest yield, it offers impressive dividend continuity and financial resilience, making it a formidable choice for conservative dividend investors. Their commitment to shareholder value, paired with their robust operational framework, positions Dover favorably for long-term profitability and growth.
Smart Data Insight
Master the Perfect Entry & Exit for this Stock
Don't leave your profits to chance. Historically, this stock follows specific seasonal patterns that institutional traders use to maximize returns.
- ✅ Identify the "Golden Buying Window"
- ✅ Avoid high-risk correction cycles
- ✅ Backtested data from the last 20+ years