September 28, 2025 a 07:47 am

DOV: Dividend Analysis - Dover Corporation
Dover Corporation, a global player with a market cap of over 23 billion USD, offers a modest but consistent dividend yield of 1.15%. The company has a remarkable dividend history of over 44 years without cuts, indicating strong resilience and commitment to returning value to shareholders. Despite the low dividend yield, the stability and growth potential make Dover an intriguing option for dividend-focused investors.
📊 Overview
Dover Corporation operates within a diverse sector, providing industrial products and services that cater to a broad audience. Its dividend yield stands at a modest 1.15%, with the current dividend per share at 2.05 USD. With a solid 44-year history of dividend payments, Dover has showcased stability and reliability in sustaining shareholder returns. Notably, there have been no recent cuts or suspensions in its dividend commitments, underscoring its financial robustness and disciplined management.
| Metric | Details |
|---|---|
| Sector | Industrial Manufacturing |
| Dividend Yield | 1.15% |
| Current Dividend Per Share | 2.05 USD |
| Dividend History | 44 years |
| Last Cut or Suspension | None |
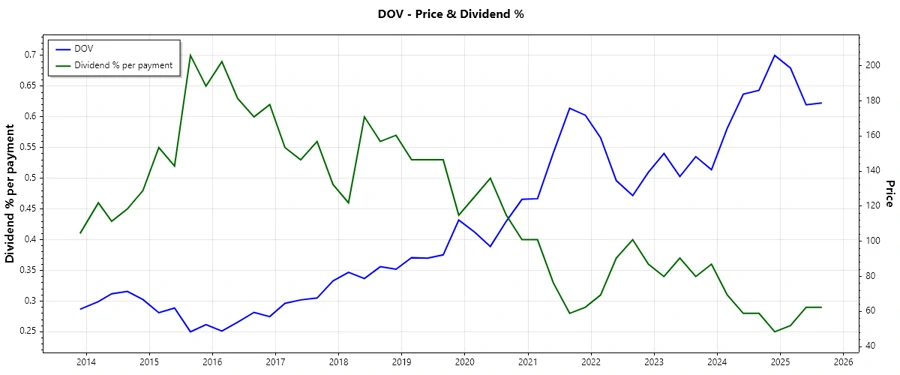
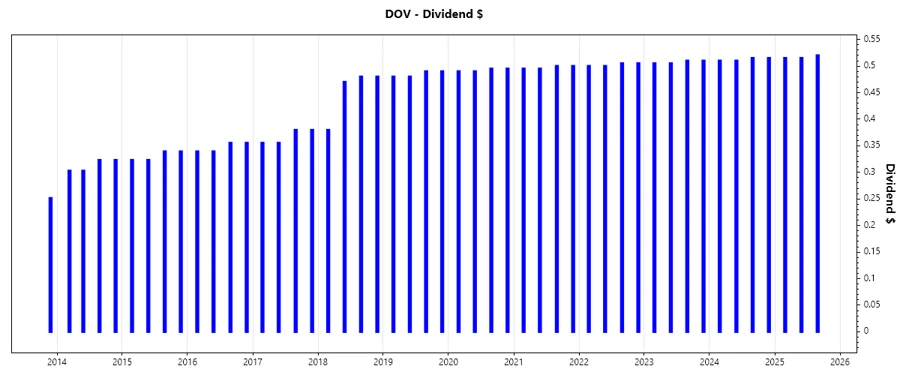
🗣️ Dividend History
The historical consistency of dividend payments signifies Dover's commitment to its shareholders. Examining past dividends provides insights into financial health and potential biases for forecasting future disbursements. Stability in this area is often synonymous with low risk, appealing for risk-averse investors.
| Year | Dividend Per Share (USD) |
|---|---|
| 2025 | 1.55 |
| 2024 | 2.05 |
| 2023 | 2.03 |
| 2022 | 2.01 |
| 2021 | 1.99 |
📈 Dividend Growth
Dividend growth reflects a company's profitability and willingness to increase shareholder returns. Dover's 3-year and 5-year growth rates reveal a modest but consistent increase in dividend payments, highlighting the management's commitment to delivering long-term value despite market volatility.
| Time | Growth |
|---|---|
| 3 years | 0.99% |
| 5 years | 1.11% |
The average dividend growth is 1.11% over 5 years. This shows moderate but steady dividend growth.
💰 Payout Ratio
Payout ratios give insights into how comfortably a company can sustain its dividends. Dover's EPS-based payout ratio is impressively low at 12.30%, and its free cash flow-based payout stands at 50.64%. These figures suggest that Dover retains a significant buffer to cover dividends from earnings and cash flow, reinforcing its dividend policy's sustainability.
| Key Figure | Ratio |
|---|---|
| EPS-based | 12.30% |
| Free Cash Flow-based | 50.64% |
With an EPS payout under 13% and FCF payout just above 50%, Dover displays a conservative approach, preserving ample capital to weather economic downturns while maintaining dividend payments.
💵 Cashflow & Capital Efficiency
Understanding cash flow dynamics and capital efficiency gauges a company's overall financial robustness and potential growth. This involves examining how effectively a company generates free cash flow relative to earnings and capital expenditure—and how efficiently it's using capital. Such metrics illuminate operational effectiveness and value generation capabilities.
| Year | 2024 | 2023 | 2022 |
|---|---|---|---|
| Free Cash Flow Yield | 2.25% | 5.32% | 3.03% |
| Earnings Yield | 10.44% | 4.91% | 5.51% |
| CAPEX to Operating Cash Flow | 22.39% | 14.42% | 27.42% |
| Stock-based Compensation to Revenue | 0.52% | 0.41% | 0.39% |
| Free Cash Flow / Operating Cash Flow Ratio | 77.61% | 85.59% | 72.58% |
Overall, the relatively high free cash flow yield aligned with healthy earnings yield figures indicates a solid financial footing, allowing Dover flexibility in its capital allocation strategies and shareholder return policies.
🗂️ Balance Sheet & Leverage Analysis
Analysing balance sheet and leverage empowers an investor to understand financial stability and risk exposure. Key metrics shed light on debt structure, interest cover, and the overall liquidity profile. Ensuring ratios are within acceptable boundaries will reflect on the firm's long-term solvency.
| Year | 2024 | 2023 | 2022 |
|---|---|---|---|
| Debt-to-Equity | 0.45 | 0.72 | 0.91 |
| Debt-to-Assets | 0.25 | 0.32 | 0.36 |
| Debt-to-Capital | 0.31 | 0.42 | 0.48 |
| Net Debt to EBITDA | 0.59 | 2.10 | 2.19 |
| Current Ratio | 2.04 | 1.40 | 1.23 |
| Quick Ratio | 1.52 | 0.90 | 0.74 |
Dover's improving debt-to-equity and higher coverage ratios suggest strengthened financial positioning, reducing bankruptcy risks and maintaining operational fluidity amid potential market adversities.
📈 Fundamental Strength & Profitability
Evaluating profitability and strength fundamentals offers valuable insights into efficiency and strategic positioning within the market. Metrics like return rates and margins exhibit the company’s prowess in generating profit relative to various baselines, aiding in comparing peers within sectors.
| Year | 2024 | 2023 | 2022 |
|---|---|---|---|
| Return on Equity | 38.79% | 20.70% | 24.85% |
| Return on Assets | 21.56% | 9.31% | 9.78% |
| Net Margin | 34.82% | 13.75% | 13.58% |
| EBIT Margin | 24.38% | 16.32% | 16.66% |
| EBITDA Margin | 28.74% | 20.29% | 20.43% |
| Research & Development to Revenue | 0% | 0% | 0% |
High returns and solid profit margins validate Dover's strategic leverage and cost-control efficiencies, suggesting a sustained competitive advantage and lucrative profitability outlook in their sector trajectory.
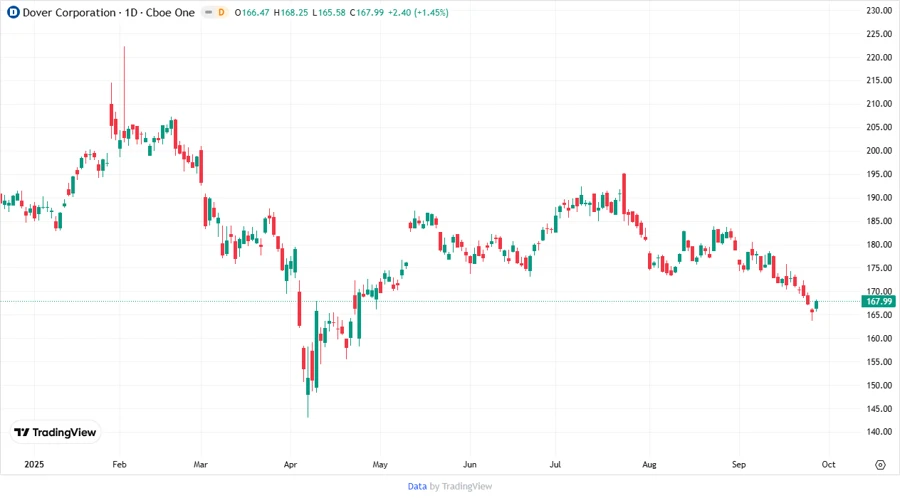
💹 Price Development
✅ Dividend Scoring System
| Criteria | Score | Score Bar |
|---|---|---|
| Dividend Yield | 3 | |
| Dividend Stability | 5 | |
| Dividend Growth | 2 | |
| Payout Ratio | 4 | |
| Financial Stability | 4 | |
| Dividend Continuity | 5 | |
| Cashflow Coverage | 3 | |
| Balance Sheet Quality | 4 |
Total Score: 30/40
📉 Rating
Dover Corporation scores a commendable 30 out of 40 in our dividend scoring system, underscoring its strong financial base and resilience in its dividend payments. The company's strategic management of capital and prudent financial policies make it a reputable choice for those valuing dividend stability and modest growth potential. As such, Dover Corporation holds a moderate "BUY" recommendation for income-focused investors, with ongoing considerations for future revenue growth and market conditions.
Smart Data Insight
Master the Perfect Entry & Exit for this Stock
Don't leave your profits to chance. Historically, this stock follows specific seasonal patterns that institutional traders use to maximize returns.
- ✅ Identify the "Golden Buying Window"
- ✅ Avoid high-risk correction cycles
- ✅ Backtested data from the last 20+ years