September 11, 2025 a 11:32 am


DOV: Dividend Analysis - Dover Corporation
The analysis of Dover Corporation reveals a robust dividend profile characterized by a long history of dividend payments, a moderate payout ratio, and consistent dividend growth. Despite a modest dividend yield, the stability and sustainability of dividends make it an attractive choice for income-focused investors. Additionally, the corporation's strong financial position and operational efficiency support its capacity to maintain and potentially increase dividend distributions in the future.
Overview 📊
Dover Corporation operates within the industrial sector, serving various end markets. Its dividend yield is relatively modest at 1.15%, reflecting market conditions and recent performance. Despite this, the current dividend per share stands at $2.06, showing strength in shareholder returns. Impressively, Dover has maintained an uninterrupted dividend history for 44 years, demonstrating a commitment to returning value to shareholders without any recent suspensions or cuts.
| Sector | Dividend Yield | Current Dividend Per Share | Dividend History (Years) | Last Cut or Suspension |
|---|---|---|---|---|
| Industrial | 1.15% | $2.06 USD | 44 years | None |
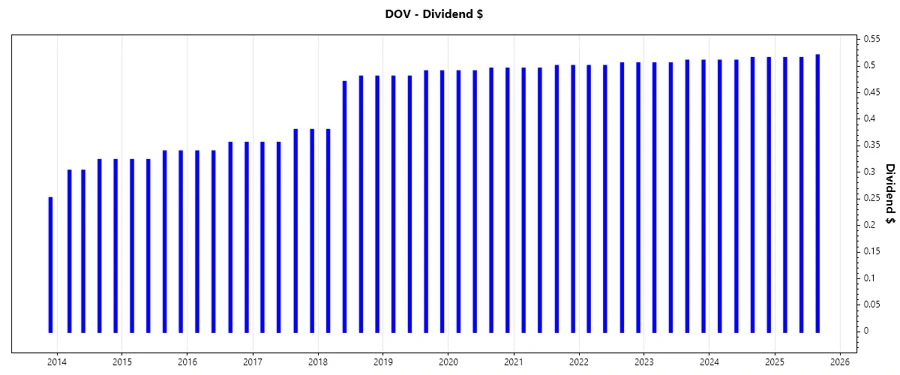
Dividend History 📈
Dover Corporation's commitment to its dividend policy is demonstrated by its extensive dividend history spanning over four decades. This stability is crucial for income investors seeking reliable returns, as it reflects strong management practices and resilient financial health. The historical progression of dividends provides insights into the company’s dedication to enhancing shareholder value.
| Year | Dividend Per Share (USD) |
|---|---|
| 2025 | $1.55 |
| 2024 | $2.05 |
| 2023 | $2.03 |
| 2022 | $2.01 |
| 2021 | $1.99 |
Dividend Growth 📉
Understanding dividend growth is vital for assessing future income potential from the stock. While recent growth has been modest, it suggests that the company is focusing on maintaining predictable payouts amidst macroeconomic challenges, balancing reinvestment needs with shareholder returns. Investors should view consistent moderate growth as a positive indicator of financial discipline and strategic foresight.
| Time Period | Growth |
|---|---|
| 3 years | 0.99% |
| 5 years | 1.11% |
The average dividend growth is 1.11% over 5 years. This indicates a moderate but steady dividend growth trajectory, which can provide a reliable income base for investors prioritizing long-term wealth accumulation.
Payout Ratio ✅
The payout ratio is a key indicator of financial health and sustainability of dividends. Dover’s EPS-based payout ratio stands at a conservative 12.30%, suggesting ample room to cover and potentially enhance dividend distributions. This low ratio implies strong earnings retention for growth initiatives. Furthermore, the FCF-based ratio is a substantial 50.64%, reflecting a balanced allocation of cash flow between dividends and internal investments.
| Key Figure | Ratio |
|---|---|
| EPS-based | 12.30% |
| Free Cash Flow-based | 50.64% |
These ratios indicate a prudent approach to managing shareholder payouts while ensuring future growth and resilience against economic fluctuations.
Cashflow & Capital Efficiency 💰
Analyzing cash flow and capital efficiency metrics reveals Dover Corporation’s robust operational framework. Indicators such as Free Cash Flow Yield and CAPEX to Operating Cash Flow are crucial to evaluate how efficiently the company converts revenue into actual cash, crucial for sustaining dividends and funding growth.
| Year | 2024 | 2023 | 2022 |
|---|---|---|---|
| Free Cash Flow Yield | 2.25% | 5.31% | 3.03% |
| Earnings Yield | 10.44% | 4.91% | 5.51% |
| CAPEX to Operating Cash Flow | 22.39% | 14.41% | 27.42% |
| Stock-based Compensation to Revenue | 0.52% | 0.41% | 0.39% |
| Free Cash Flow / Operating Cash Flow Ratio | 77.61% | 85.59% | 72.58% |
Such indicators, along with a stable Cash Flow/Operating Cash Flow Ratio, demonstrate Dover’s strong capacity for capital allocation and investment, supporting its dividend policy while fostering operational growth.
Balance Sheet & Leverage Analysis 🏦
Dover Corporation maintains a sturdy balance sheet, showcasing solid leverage ratios that enhance financial stability. An effective Debt-to-Equity position and prudent debt management underline a disciplined approach to financial leverage, crucial for risk management and long-term viability.
| Year | 2024 | 2023 | 2022 |
|---|---|---|---|
| Debt-to-Equity | 45.35% | 72.04% | 90.68% |
| Debt-to-Assets | 25.21% | 32.42% | 35.67% |
| Debt-to-Capital | 31.20% | 41.87% | 47.55% |
| Net Debt to EBITDA | 0.59 | 2.10 | 2.19 |
| Current Ratio | 2.04 | 1.40 | 1.23 |
| Quick Ratio | 1.52 | 0.90 | 0.74 |
| Financial Leverage | 1.80 | 2.22 | 2.54 |
The company's ability to refinance and manage debt sustainably underpins its financial strength, reducing cost of capital and enhancing its credit profile.
Fundamental Strength & Profitability 🏆
Profitability metrics such as Return on Equity and Margins provide insights into the company’s operational efficiency. Dover's strong returns demonstrate competent management and an ability to provide substantial shareholder returns. Additionally, robust margins are crucial indicators of cost efficiency and competitive advantage.
| Year | 2024 | 2023 | 2022 |
|---|---|---|---|
| Return on Equity | 38.79% | 20.70% | 24.85% |
| Return on Assets | 21.56% | 9.31% | 9.78% |
| Net Margin | 34.82% | 13.75% | 13.58% |
| EBIT Margin | 24.38% | 16.32% | 16.66% |
| EBITDA Margin | 28.74% | 20.29% | 20.43% |
| Gross Margin | 38.20% | 37.32% | 37.03% |
Quantitative metrics suggest Dover efficiently converts revenue into profits, reassuring stakeholders of its market position and vitality.
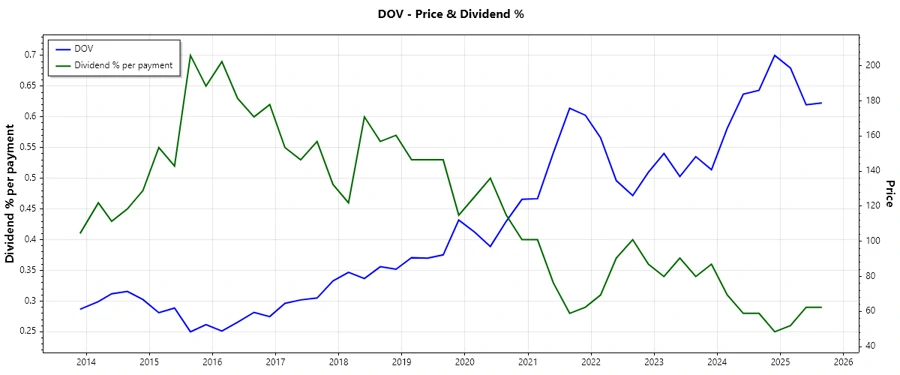
Price Development 💹
Dividend Scoring System 🗣️
This comprehensive scoring system evaluates critical facets of Dover's dividend performance, providing a holistic view of its dividend reliability and sustainability.
| Category | Score | Score Bar |
|---|---|---|
| Dividend Yield | 3/5 | |
| Dividend Stability | 5/5 | |
| Dividend Growth | 3/5 | |
| Payout Ratio | 4/5 | |
| Financial Stability | 4/5 | |
| Dividend Continuity | 5/5 | |
| Cashflow Coverage | 4/5 | |
| Balance Sheet Quality | 4/5 |
Total Score: 32/40
Rating ✨
In conclusion, Dover Corporation presents a compelling case for dividend investors, balancing a solid historical track record with future consistency and modest growth. The corporation's strategic financial management and robust operational efficiencies support a favorable outlook, making it a viable option for those seeking stable income and long-term capital appreciation.
Smart Data Insight
Master the Perfect Entry & Exit for this Stock
Don't leave your profits to chance. Historically, this stock follows specific seasonal patterns that institutional traders use to maximize returns.
- ✅ Identify the "Golden Buying Window"
- ✅ Avoid high-risk correction cycles
- ✅ Backtested data from the last 20+ years