August 24, 2025 a 02:47 am


DOV: Dividend Analysis - Dover Corporation
Dover Corporation showcases a robust commitment to delivering shareholder value through consistent dividend payouts. The stability of dividends over 44 years reflects solid earnings power. Investors might be drawn by the trust this history instills, even while the current yield of 1.13% may appear modest. As a financially sound entity in the industrial sector, Dover's strategy seems to prioritize sustainable growth and reliable returns.
📊 Overview
Dover Corporation operates in the industrial sector with a focus on diversified products. The company's dividend yield stands at 1.13%, which, while not the most competitive, underscores a reliable payout process with $2.06 as the current dividend per share. Impressively, Dover has maintained an uninterrupted dividend history spanning 44 years, further bolstering investor confidence. The company hasn't experienced any recent cut or suspension in dividends, indicating financial resilience.
| Metric | Value |
|---|---|
| Sector | Industrial |
| Dividend Yield | 1.13% |
| Current Dividend Per Share | 2.06 USD |
| Dividend History | 44 years |
| Last Cut or Suspension | None |
🗣️ Dividend History
The historical consistency of Dover's dividends is a testament to its durable business operations and financial management capabilities. Such a history not only reassures current investors but also attracts prospective ones by projecting stability.
| Year | Dividend Per Share (USD) |
|---|---|
| 2025 | 1.55 |
| 2024 | 2.05 |
| 2023 | 2.03 |
| 2022 | 2.01 |
| 2021 | 1.99 |
📈 Dividend Growth
The dividend growth rate provides insight into the company's strategy towards rewarding shareholders. Dover presents moderate growth with a 5-year average of 1.11%, indicating steady enhancement of shareholder returns, albeit at a conservative rate.
| Time | Growth |
|---|---|
| 3 years | 0.99% |
| 5 years | 1.11% |
The average dividend growth is 1.11% over 5 years. This shows moderate but steady dividend growth.
✅ Payout Ratio
Payout ratios are essential in assessing a company's capacity to maintain its dividends. An EPS-based payout ratio of 12.3% and an FCF-based ratio of 50.64% reflect a conservative approach, ensuring dividend safety through sustainable earnings coverage.
| Key Figure | Ratio |
|---|---|
| EPS-based | 12.30% |
| Free cash flow-based | 50.64% |
With an EPS payout of 12.30% and an FCF payout of 50.64%, Dover adequately covers its dividends through both earnings and free cash flow, indicating both safety and efficiency.
Cashflow & Capital Efficiency
A thorough cash flow analysis helps to determine a company's liquidity position and investment capabilities. Dover's metrics such as free cash flow yield and earnings yield highlight efficient cash management and value generation.
| Measure | 2024 | 2023 | 2022 |
|---|---|---|---|
| Free Cash Flow Yield | 2.25% | 5.32% | 3.03% |
| Earnings Yield | 10.44% | 4.91% | 5.51% |
| CAPEX to Operating Cash Flow | 22.39% | 14.41% | 27.42% |
| Stock-based Compensation to Revenue | 0.52% | 0.37% | 0.36% |
| Free Cash Flow / Operating Cash Flow Ratio | 77.61% | 85.59% | 72.58% |
Dover's capital efficiency demonstrates prudent cash flow management, supporting ongoing operations while maintaining sufficient cash reserves for strategic opportunities.
Balance Sheet & Leverage Analysis
Understanding Dover's leverage helps evaluate its financial risk and capital structure. The following ratios provide insight into debt levels and liquidity:
| Ratio | 2024 | 2023 | 2022 |
|---|---|---|---|
| Debt-to-Equity | 0.45 | 0.72 | 0.91 |
| Debt-to-Assets | 0.25 | 0.32 | 0.36 |
| Debt-to-Capital | 0.31 | 0.42 | 0.48 |
| Net Debt to EBITDA | 1.02 | 1.91 | 2.05 |
| Current Ratio | 2.04 | 1.40 | 1.23 |
| Quick Ratio | 1.52 | 0.90 | 0.74 |
| Financial Leverage | 1.80 | 2.22 | 2.54 |
Dover's declining leverage ratios signal strengthened financial stability, offering reassurance about its ability to meet both short and long-term obligations.
Fundamental Strength & Profitability
Profitability metrics, such as ROE and margins, reveal Dover's operational efficiency and competitive positioning within the market.
| Metric | 2024 | 2023 | 2022 |
|---|---|---|---|
| Return on Equity | 38.78% | 20.70% | 24.85% |
| Return on Assets | 21.56% | 9.31% | 9.78% |
| Net Profit Margin | 34.82% | 12.52% | 12.52% |
| EBIT Margin | 24.38% | 16.61% | 16.50% |
| EBITDA Margin | 28.74% | 20.37% | 20.12% |
| Gross Margin | 38.20% | 36.56% | 36.09% |
| Research & Development to Revenue | 1.93% | 1.65% | 1.78% |
Boasting robust ROE and steady margins, Dover reinforces its position as a competitive force, leveraging efficient operations to generate substantial shareholder returns.
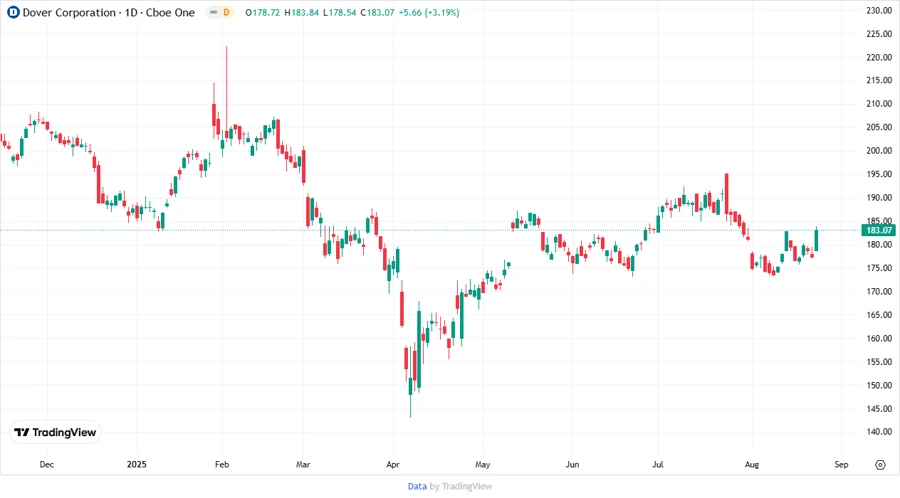
Price Development
➡️ Dividend Scoring System
| Criteria | Score (1-5) | Representation |
|---|---|---|
| Dividend Yield | 3 | |
| Dividend Stability | 5 | |
| Dividend Growth | 3 | |
| Payout Ratio | 5 | |
| Financial Stability | 4 | |
| Dividend Continuity | 5 | |
| Cashflow Coverage | 4 | |
| Balance Sheet Quality | 4 |
Total Score: 33/40
✅ Rating
Dover Corporation garners a favorable assessment due to its strong financial foundation, steadfast dividend history, and balanced approach to growth and returns. The company offers a solid investment opportunity for those seeking reliability with moderate income generation.
Smart Data Insight
Master the Perfect Entry & Exit for this Stock
Don't leave your profits to chance. Historically, this stock follows specific seasonal patterns that institutional traders use to maximize returns.
- ✅ Identify the "Golden Buying Window"
- ✅ Avoid high-risk correction cycles
- ✅ Backtested data from the last 20+ years