October 24, 2025 a 01:15 pm
DLTR: Trend and Support & Resistance Analysis - Dollar Tree, Inc.
The analysis of Dollar Tree, Inc. shows a shift in the stock's momentum with notable trends. Based on recent data, the stock is positioned for potential movements influenced by key support and resistance levels. Understanding these pivotal zones can provide investors with insights into strategic entry and exit points.
Trend Analysis
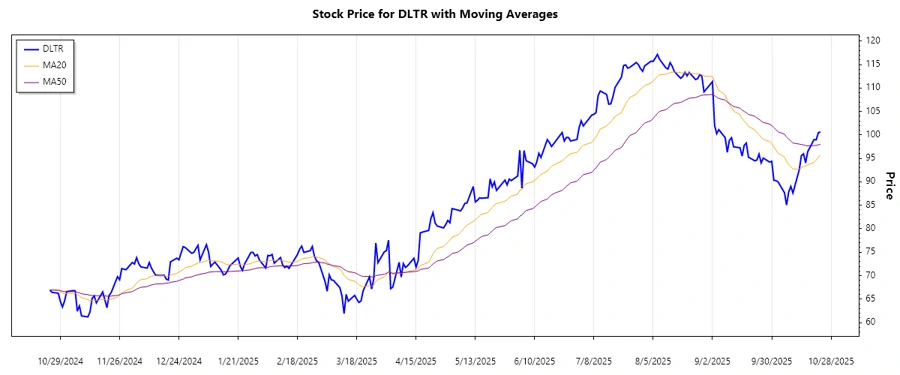
The recent trend of Dollar Tree, Inc. was derived using EMA calculations. With the EMA20 being 98.11 and the EMA50 at 98.54, the stock is in a slight downward trend. This suggests a ▼ Abwärtstrend based on the moving averages crossover.
| Date | Close Price | Trend |
|---|---|---|
| 2025-10-23 | $100.62 | ▲ |
| 2025-10-22 | $100.47 | ▲ |
| 2025-10-21 | $98.95 | ▼ |
| 2025-10-20 | $99.02 | ▲ |
| 2025-10-17 | $96.44 | ▼ |
| 2025-10-16 | $94.03 | ▼ |
| 2025-10-15 | $95.97 | ▲ |
Technically speaking, this crossover suggests a downturn in momentum, prompting caution for those considering entry or expansion of positions.
Support and Resistance
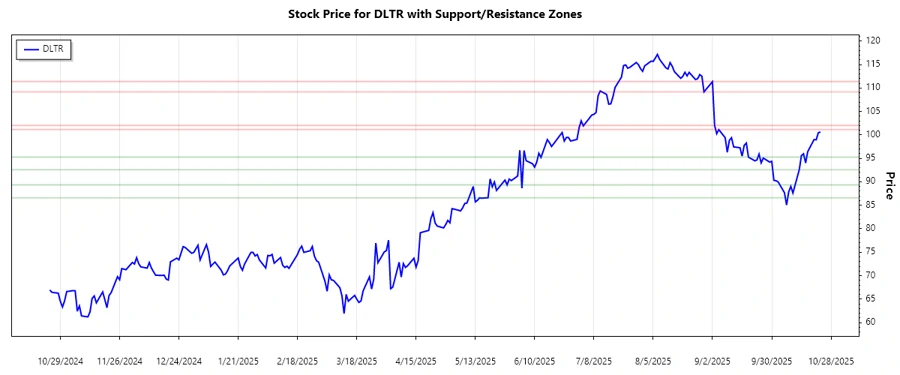
Based on the historical price data, significant support and resistance zones have been identified.
| Zone Type | From | To |
|---|---|---|
| Support | $86.58 | $89.34 |
| Support | $92.59 | $95.26 |
| Resistance | $101.12 | $102.03 |
| Resistance | $109.17 | $111.35 |
Currently, the stock trades around $100.62, positioning it below the first resistance level, indicating a likelihood of remaining within the current support zone if the momentum doesn't change.
The technical setup suggests a cautious outlook until the stock breaks out decisively from these levels.
Conclusion
Dollar Tree, Inc. shows signs of a recent downturn in momentum, with the stock oscillating between key support and resistance zones. For analysts and investors, the identified support and resistance zones provide crucial insights for strategic decision-making. The existing price action suggests focusing on price movement towards the upper resistance levels for possible breakout opportunities. Nonetheless, caution is warranted as sustained movement below support levels could signal further declines.
Smart Data Insight
Master the Perfect Entry & Exit for this Stock
Don't leave your profits to chance. Historically, this stock follows specific seasonal patterns that institutional traders use to maximize returns.
- ✅ Identify the "Golden Buying Window"
- ✅ Avoid high-risk correction cycles
- ✅ Backtested data from the last 20+ years