June 21, 2025 a 01:15 pm
DLTR: Trend and Support & Resistance Analysis - Dollar Tree, Inc.
Dollar Tree, Inc. operates discount variety retail stores with significant presence across North America. Recently, the stock has shown mixed performance with varying trends in its price movements. By utilizing technical analysis, potential investors can gain insights into future price directions and resistance zones. This analysis serves to shed light on the stock's recent behavior and provide insights into potential support and resistance levels.
Trend Analysis
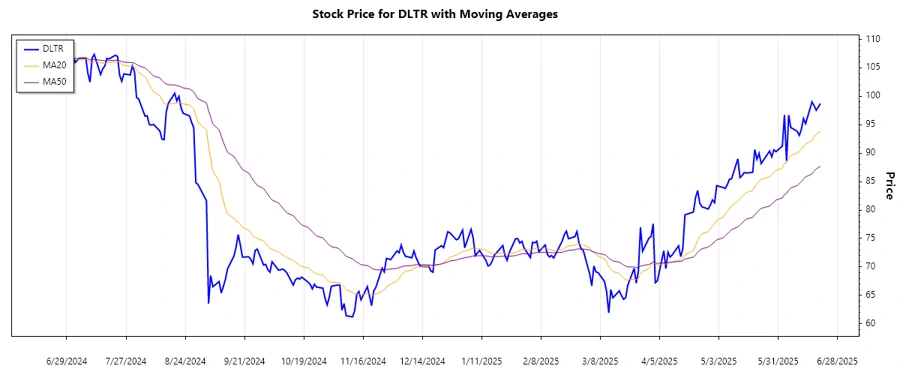
The analysis of Dollar Tree, Inc. based on the recent daily closing prices highlights a complex movement pattern. The trend is identified by comparing EMA20 and EMA50. The observation shows that EMA20 was recently positioned slightly above EMA50, signaling the emergence of an upward trend, albeit weak. This transition suggests an optimistic momentum, provided this alignment sustains in subsequent periods.
| Date | Close Price | Trend |
|---|---|---|
| 2025-06-20 | 98.71 | ▲ |
| 2025-06-18 | 97.53 | ▲ |
| 2025-06-17 | 98.35 | ▲ |
| 2025-06-16 | 99.00 | ▲ |
| 2025-06-13 | 95.19 | ▼ |
| 2025-06-12 | 96.09 | ▲ |
| 2025-06-11 | 94.21 | ▼ |
Conclusively, Dollar Tree, Inc.'s stock is teetering on the brink of a potential upward swing; however, caution should be exercised as volatility persists. If EMA20 consistently stays above EMA50, it could signal sustained bullish sentiment.
Support- and Resistance
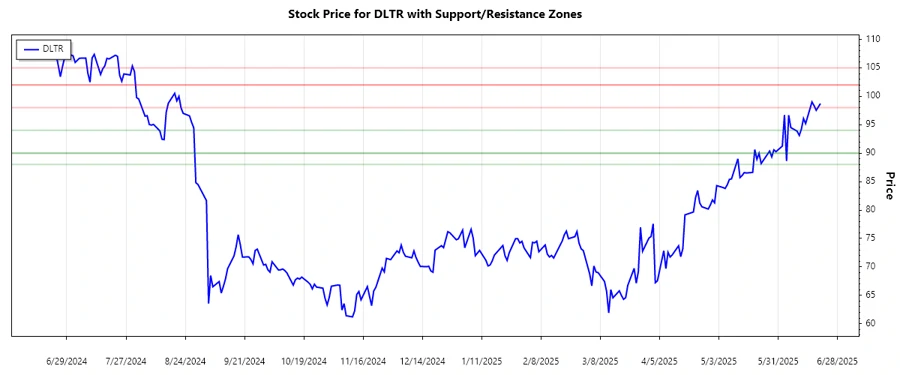
The current analysis of Dollar Tree, Inc.'s price action identifies critical support and resistance levels. Through meticulous examination, two primary support zones around $90 and $94 have been determined. Likewise, resistance zones are pegged at approximately $98 and $102. These levels are crucial in assessing price action, indicating potential turning or consolidation points.
| Zone Type | From | To |
|---|---|---|
| Support | 90.00 | 94.00 |
| Support | 88.00 | 90.00 |
| Resistance | 98.00 | 102.00 |
| Resistance | 102.00 | 105.00 |
The current price situation places it near the top of a support range, suggesting a pivotal point which could potentially reinforce upward momentum if crossed.
Ultimately, breaking through the delineated resistance zones will validate a stronger bullish trend, while dipping below support could signal bearish pressures.
Conclusion
Dollar Tree, Inc.'s stock exhibits signs of transitioning into an upward trend, substantiated by recent EMA interactions. However, potential adjustments in market sentiment could disrupt this trend. Investors are advised to monitor the established support and resistance levels diligently. While an upward break could capitalize on the stock's bullish momentum, any downturn could entrain substantial risks requiring tactical reassessment.
Smart Data Insight
Master the Perfect Entry & Exit for this Stock
Don't leave your profits to chance. Historically, this stock follows specific seasonal patterns that institutional traders use to maximize returns.
- ✅ Identify the "Golden Buying Window"
- ✅ Avoid high-risk correction cycles
- ✅ Backtested data from the last 20+ years